Вернуться на страницу ежегодника Следующая статья
III. Climate and Environment
The Greening of the Global South? Analyzing World Values Survey and European Values Survey Data on Environmental Movements in 88 Countries and Territories
from 2017–2021 (Download pdf)
DOI: https://doi.org/10.30884/978-5-7057-6354-2_09
Arno Tausch, University of the Free State, Bloemfontein, South Africa
Abstract
This study focuses on the analysis of public opinion survey data on trust and participation in environmental movements fr om the World Values Survey and the European Values Survey, covering 88 countries and territories fr om 2017 onwards. Are we witnessing a greening of the Global South? Most of the existing, highly influential studies on this topic are based on earlier waves of the World Values Survey and the European Values Survey, with only a limited number of countries fr om the Global South covered in the surveys.
Our multivariate analysis suggests that, in today's world, it is rather the Global South that is 'greening' and wh ere environmental movements enjoy the highest levels of participation and confidence. We also show that, holding human development indices constant, this greening of the Global South has overall positive effects on the socio-economic development of the countries concerned.
Keywords: environmental movements, global comparisons, opinion surveys, Global South, World Values Survey, European Values Survey.
Introduction
This study focuses on the analysis of public opinion survey data on trust and participation in environmental movements from the World Values Survey and the European Values Survey, covering 88 countries and territories from 2017 onwards. Are we witnessing a greening of the Global South? Most of the existing, highly influential studies on this topic are based on earlier waves of the World Values Survey and the European Values Survey, with only a limited number of countries from the Global South included in the surveys.
The importance of the issues analyzed here cannot be underestimated. Brand (2015, 2023; Brand and Lang 2015) argues that in contrast to the concept and strategy of sustainable development in the 1990s, a green economy now appears to be attractive to relevant socio-economic actors. Technologies are available to develop renewable energy sources or electronic engines for cars, and microelectronics play a much more important role today than 20 years ago. And there is another dynamic, namely the current crisis, the main cause of which is an enormous amount of over-accumulated capital looking for new investment opportunities. Brand (2015, 2023) and Brand and Lang (2015) also point out that finance capital has discovered agriculture, land, infrastructure and environmental protection as new areas of investment, creating opportunities for a few and threatening the livelihoods of many, especially in the Global South.
With the emergence of countries such as China, India and Brazil as strong and confident economies, Brand (Ibid.) predicts new geopolitical rivalries over scarce resources. For example, last year the Chinese government banned the export of certain rare minerals for use in manufacturing processes in China. Brand (Ibid.), along with the European Commission, also highlights the growing competition for resources.
Our study is structured as follows: first, we discuss the theoretical background, then we provide a brief overview of our data and the multivariate methods used, and finally the results and conclusions of our work are presented.
Background Developments at the Global Level
The political-economic starting point facing environmental movements has been summarized by Brand (Ibid.), who emphasises that liberal policies of open markets and fierce competition have led to deindustrialization in many countries of the Global South. What makes sense from a neoclassical perspective – production taking place wh ere it is most efficient – has pushed many countries into the new-old strategy of resource extractivism. According to Brand (Ibid.), for most countries in Latin America this seems to be the only viable development strategy to alleviate poverty and globalization means above all what can be called an ‘imperial way of life’. Globalized liberal markets are inscribed in everyday practices in the sense that access to cheap and often unsustainably produced goods and labour is normalized. This is not particularly controversial in times of crisis and is universalized among the global upper and middle classes.
We briefly mentioned above that existing studies on environmental movements and global values have not yet adequately taken into account the dimension of the Global South, which is playing an increasingly important role in an increasingly multicentric world facing multiple crises.
According to Dunlap and York (2008), the presumed lack of widespread concern for the environment in LDCs follows from the assumption in many current global values studies that environmental quality is a higher-order, quality-of-life value that poor people struggling to meet basic needs cannot afford to support. They point out that leading values research (see below) assumes a lack of environmental concern among citizens in the world's poorer nations. Post-materialist, pro-environmental values, the argument goes, are far more prevalent in wealthy nations than in poor ones.
And yet, recent advances in environmental political economy, which examine the relationships between variables such as globalization, carbon emissions, population growth, urbanization, etc. would suggest that global values research would also be obliged to produce evidence focusing specifically on the growing importance of the ecology movement in the countries of the Global South.
For example, in a widely read study on the political ecology of the environment, Jorgenson (2012) argues that transnational corporations are building new or acquiring existing facilities in less developed countries – such as in Asia and Latin America – to take advantage of lower production costs and more permissive environmental laws. As he notes, this shift in production has contributed to an increase in carbon emissions in less developed countries, even though many of the products are consumed in developed countries. The modest, relative decoupling between total emissions and development in the countries of the global North may in fact be linked to two sets of structural processes in countries of the global South: (1) the intensification of the relationship between per capita emissions and economic development, and (2) the temporal stability of the strong relationship between total emissions and economic development. Therefore, Jorgenson (2012) points out that the dynamics of the global economic system require that a conceptualization of shifts be incorporated into the assessment of environment-economic development relationships.
The study of the interaction between level of development – or if you wish, existential security – and the state of the environment involve several highly intricate methodological issues. In a highly influential study on this subject, Liddle (2014) critically discusses the assumptions of the Environmental Kuznets Curve (EKC)[1]. Dinda (2004) in his highly influential study on the subject, stipulated that the Environmental Kuznets Curve (EKC) hypothesis postulates an inverted-U-shaped relationship between different pollutants and per capita income, i.e., environmental pressure increases up to a certain level as income goes up; after that, it decreases. He also highlights that the common point of all the studies is the assertion that the environmental quality deteriorates at the early stages of economic development/growth and subsequently improves at the later stages (Dinda 2004). In other words, environmental pressure increases faster than income at early stages of development and slows down relative to GDP growth at higher income levels. Dinda (Ibid.) discusses the various explanations for this EKC: (a) the progress of economic development, from clean agrarian economy to polluting industrial economy to clean service economy; (b) tendency of people with higher income having higher preference for environmental quality, etc.
Liddle (2014) highlights
in this context that the empirical consideration of many cross-sectional units
combined with observations taken at many time intervals (i.e., time series – cross-sectional or panel data)
offers substantial advantages over simple cross-sectional analysis, for example,
(1) using country and/or time-fixed effects to control for some omitted
variables (i.e., factors that may
affect emissions that are not captured by variables specified in the regression
model, such as economic shocks, changes in population policies, or other
country-specific development pathways); (2) increasing substantially the
degrees of freedom; and (3) allowing for dynamic modelling (e.g., estimating short-run and long-run
effects). However, as he notes, employing such time series and cross-sectional
data both introduces statistical challenges and provides opportunities to
address those challenges and other modelling issues: namely, serial
correlation, non-stationarity, cross-sectional dependence, heterogeneity, nonlinearities, and endogeneity.
Liddle (Ibid.) also makes the point
that
a variable, which is
particularly strongly related to global value change, population growth (see
also Tausch, Heshmati, and Karoui 2014) and its impact on the level of national
carbon emissions has not been explicitly explored. He also points out that
urbanization may lead to higher emissions/energy consumption through urbanization's association with
industrialization,
that is, the shift from
agriculture to industry and services. The
co-evolving movement of people from rural to urban areas and from
agricultural to industrial employment causes energy consumption to increase in
three ways: (1) agricultural operations must mechanize as they become less
labor-intensive; (2) urbanization spatially separates food consumers from food
producers, thus necessitating a transport requirement that did not exist under
traditional agriculture and settlement patterns; and (3) modern
industry/manufacturing uses more energy per unit of output and per worker than
does traditional agricultural and manufacturing.
Such shifts will even increase the importance of the question of how economic changes in the Global South affect the strength of the environmental movement in the Global South.
In a recent study on the globalization-oriented drivers of the global environmental crisis, Tausch and Heshmati (2013) have closed the circuit from the usual studies on globalization and environmental degradation. The study showed severe detrimental effects of ‘globalization’ measurement yardsticks, such as high foreign savings, free production zones employment as a % of total population, MNC penetration, and large-scale immigration on environmental data.
The Analysis of Global Values
The major existing sociological theories of global values (Tausch, Heshmati, and Karoui 2014), to be sure, have not really focused decisively on these phenomena: Hofstede (Hofstede, Hofstede, and Minkov 2010), Schwartz (2009, 2014) and his research colleague Davidov (Davidov, Schmidt, and Schwartz 2008) and finally Inglehart (Inglehart 2009, 2018, 2020; Inglehart and Baker 2000) are for us the main hitherto well-known theoretical approaches guiding the discipline of value research today.
Inglehart
Inglehart, in some of his major
publications (Ibid.; for a more detailed discussion see
also Tausch, Heshmati, and Karoui 2014) developed an interpretation of global
value change based on a well-known two-dimensional scale of global values and
global value change. It is based on the statistical technique
of factor analysis of
up to 20 key World Values Survey variables from the original 900+ WVS survey
items. These 900 items cover virtually all major areas of human concern, from
religion to politics and from economic to social life.
The two Inglehart dimensions are: (1) the Traditional/Secular-Rational; and (2) the Survival/Self-expression. In a factor analysis of ten indicators, these two dimensions explain more than 70 % of the cross-national variance. Each of these dimensions is strongly correlated with scores on other important variables. For Inglehart and Baker (2000), all pre-industrial societies have relatively low levels of tolerance for abortion, divorce, and homosexuality; and tend to emphasize male dominance in economic and political life. There is a respect for parental authority and the importance of family life, and these societies are relatively authoritarian. Most of them place a strong emphasis on religion. Advanced industrial societies tend to have the opposite characteristics.
When survival is uncertain, cultural diversity seems threatening. When there is not ‘enough to go around’, foreigners are seen as dangerous outsiders who may take away one's livelihood. People cling to traditional gender roles and sexual norms, and emphasize absolute rules and family norms to maximize predictability in an uncertain world. Conversely, when survival is taken for granted, ethnic and cultural diversity becomes increasingly acceptable. Beyond a certain point, diversity is not only tolerated but may be positively valued because it is interesting and stimulating. In advanced industrial societies, people seek out foreign restaurants to try new cuisines; they pay large sums of money and travel long distances to experience exotic cultures. Changing gender roles and sexual norms no longer seems threatening.
Tanzania, Puerto Rico, and Jordan are the least secular countries in the world, while Sweden, Japan and the Czech Republic are the most secular.
New Zealand, Australia and the United States are the most self-expressive countries in the world, while the five most survivalist and least self-expressive countries in the world are all Orthodox Christian heritage: Moldova, Ukraine, Russia, Belarus, and Romania.
As might be expected from a standard principal components analysis, the bivariate correlation between the two factors is indeed very low (Ibid.). There is an interesting wave structure in the relationship between secularism and self-expression. As secularization increases, there is first a certain implosion and then a rise in self-expression scores. Inglehart sees these self-expression values as very important for ‘effective democracy’ (measured by civil and human rights and absence from corruption). Then there is a rise in self-expression values to implode again. Only at very high levels of secularization does self-expression rise in a linear fashion. This wave structure of modernization, secularization and self-expression is an important qualification of Inglehart's theory.
But in our own analyses (Ibid.), we already found that the countries of the former USSR and the countries of the Christian-Orthodox cultural tradition as a whole, and not the Muslim countries, are the real problematic cases for ‘effective democracy’, and they combine high secularization with low self-expressi-on. While Egypt and its neighbour Israel have residuals of about the same size, most Muslim countries (except for post-Soviet Kyrgyzstan and Azerbaijan) are even ahead of the three Baltic EU members Lithuania, Latvia, and Estonia. Poland, an EU member, ranks about the same as Turkey and is even behind several other Muslim countries. The prospects for Muslim countries must therefore be seen as relatively good within the strict framework of Inglehart's sociology.
For Inglehart, support for ecological movements is seen in the larger context of nations moving away from (1) the traditional/secular-rational dimension and (2) the survival/self-expression dimension.
The World Values Survey and European Values Survey Analyses on Environmental Movements
In the following, we will first attempt to provide our readers with a brief synthesis of established wisdom on global opinion surveys of environmental concerns (for a summary see Abramson and Inglehart 2009; Dunlap and York 2008; Dutcher et al. 2007; Franzen and Vogl 2013; Inglehart 2009; Inglehart and Baker 2000; Inglehart and Abramson 1994). Inglehart (see Abramson and Inglehart 2009; Inglehart 2009; Inglehart and Baker 2000; Abramson and Inglehart 1994) maintained the position that value priorities in advanced industrial society will tend to shift away from materialist concerns about economic and physical security towards greater emphasis on freedom, self-expression, and the quality of life, or post-materialist values. Arguing that differences between the for-mative socialization of young Europeans and their elders have led younger birth cohorts to give relatively high priority to freedom and self-expression, he (Ibid.) suggests that future intergenerational population replacement would bring about a shift towards new value priorities. The growth of post-materialist values will contribute to a decline of social class voting and to the rise of new social movements, particularly environmentalist movements and parties. According to Inglehart (Ibid.), changing value priorities may reshape the nature of political cleavages and the political meaning of left and right, giving rise to a new politics axis. This new axis, as he notes (Ibid.), cuts across the traditional left-right dimension, characterized by radical reform parties and movements at one pole and right authoritarian parties and movements like the Christian Coalition, the National Front, and the Republikaner at the other. Inglehart (Ibid.) demonstrates that there has been a clear trend towards post-materialism largely resulting from intergenerational population replacement. Moreover, the growth of post-materialism has occurred despite, rather than because of, rising levels of unemployment.
For Inglehart (see Abramson and Inglehart 2009; Inglehart 2009; Inglehart and Baker 2000; Inglehart and Abramson 1994), the shift from materialist to post-materialist values is not a uniquely Western phenomenon. Rather, it is found in societies with very different institutions and cultural traditions. The rise of post-materialist values is closely linked with prosperity and seems to occur wherever a society has experienced sufficient economic growth in recent decades for younger birth cohorts to experience significantly greater economic security during their formative years than older cohorts experienced. Intergenerational differences in values reflect a society's rate of economic growth. Economic growth, of course, is only one factor contributing to security or insecurity, but it happens to be (1) an important part of the story and (2) one for which we have relatively good cross-national and cross-time data. Inglehart (Ibid.) argues that war, domestic upheaval, and ethnic conflict can also have a major impact on feelings of security, but precisely because they tend to be situation-specific (and are less readily quantified), they are more difficult to analyze empirically. Intergenerational differences are remarkably robust. As he notes (Ibid.), in Western Europe, clear and substantial differences between the values of younger and older birth cohorts persisted through the recessions of the mid-1970s and the early 1980s. The post-materialist shift in values does not simply reflect current conditions: it also has a long-term component that seems to reflect the distinctive formative circumstances experienced by given birth cohorts as much as 40 or 50 years ago.
Based on their data analysis of the World Values Survey and Gallup's 24-nation ‘Health of the Planet’ (HOP) survey, for Dunlap and York (2008) the crucial issue is that both conventional wisdom and social science explanations of environmental concern as stemming from post-materialist values which would predict consistently positive relationships between citizen's concern for the environment and levels of national affluence, but clearly the first three waves of the now seven waves of the WVS (see methodology section below) do not produce supportive evidence for either. When one considers that many of the WVS items appear to be biased in favour of more pro-environmental responses from the public in wealthy than in poor nations, the results become even more noteworthy. Given the emphasis that both spokespersons of post-materialism, such as Inglehart, place on public willingness to pay for environmental protection, and that the most straightforward indicators of such willingness are consistently (if not always significantly) negatively correlated with national affluence. For Dunlap and York (Ibid.) the WVS results are particularly damaging – and even puzzling. They (Ibid.) conclude that those who have followed the rapidly accumulating evidence of citizen action for environmental protection in poor and developing nations around the world will not be surprised that environmental activism in these countries often reflects widespread public sentiment. It is clear that both environmental activism and public support for environmental protection have become global phenomena and are no longer – if they ever were – limited to the wealthy nations of the world.
Dunlap and York (Ibid.) also maintain that while it may take different forms, concern for the environment has obviously spread well beyond wealthy nations, and it is time for both policymakers and social scientists to revise their views accordingly. To conceptualize environmental quality as something that only the wealthy can afford, and that is of little concern to the poor, does violence to the facts.
Franzen and Vogl (2013) analyze the development of environmental concern by using the three waves of the environmental modules of the International Social Survey Programme. The results show that environmental concern is closely correlated with the wealth of the nations. However, environmental concern has declined in almost all nations slightly during the last two decades. The decline was lower in the countries with improving economic conditions suggesting that economic growth helps to maintain higher levels of environmental concern. The results of Franzen and Vogl (Ibid.) show that GDP has a positive effect on respondents' environmental concern, confirming the finding from the cross-sectional data. Overall, environmental concern decreased slightly in almost all countries (the exception is Chile). However, the decline was weaker in countries wh ere GDP has increased since 1993. This finding, according to Franzen and Vogl (Ibid.), is compatible with the results obtained from a time series analysis of public attitudes towards climate change in the United States. Controversies among political elites, particularly scepticism regarding climate change among Republican leaders, contributed most strongly to the decline. Franzen and Vogl (Ibid.) believe it is very likely that after 2008, the financial crisis diverted attention away from environmental concerns.
The fact that environmental concern has declined over the past two decades is, of course, bad news for the prospects of protecting the planet (Ibid.). It suggests that governments willing to implement measures for environmental protection will find it increasingly difficult to receive public support.
Methodology and Data
The World Values Survey and European Values Survey Data
Launched in 1981, the World Values Survey (WVS) is a series of nationally representative surveys conducted in nearly 100 countries, covering almost 90 % of the world's population, using a common questionnaire on the attitudes of the world's population towards religion, politics, economics, society, education, prejudice, gender and sexuality, and the family. The WVS is the largest non-commercial, cross-national, time-series survey of human beliefs and values ever conducted, and currently includes interviews with nearly 400,000 respondents (Inglehart 2020).
According to the current documentation of the WVS[2] and our own macro-quantitative data (see below), the WVS currently captures the opinions of more than five billion global residents, or about 66 % of the world's population.
The current study uses the well-established methodology of analyzing data from international surveys, again in the World Values Survey, as already presented in detail in the study by Tausch, Heshmati, and Karoui (2014). We would like to emphasize that, in addition to comparing percentages and means in cross-tabulations, the present study makes particular use of the method of partial correlations and promax factor analysis. As can be seen in Tausch, Heshmati, and Karoui (Ibid.), promax factor analysis is particularly suitable for extracting dimensions of variables that may be correlated with each other from a dataset with many variables. Table 1 shows the date of the WVS samples as well as the sample size N.
Table 1. Our surveys from the World Values Survey and the European Values Study
|
Country |
Year of Survey |
N = |
|
Albania |
2018 |
1,435 |
|
Andorra |
2018 |
1,004 |
|
Argentina |
2017 |
1,003 |
|
Armenia |
2018, 2021 |
2,723 |
|
Australia |
2018 |
1,813 |
|
Austria |
2018 |
1,644 |
|
Azerbaijan |
2018 |
1,800 |
|
Bangladesh |
2018 |
1,200 |
|
Belarus |
2018 |
1,548 |
|
Bolivia |
2017 |
2,067 |
|
Bosnia and Herzegovina |
2019 |
1,724 |
|
Brazil |
2018 |
1,762 |
|
Bulgaria |
2017 |
1,558 |
|
Canada |
2020 |
4,018 |
|
Chile |
2018 |
1,000 |
|
China |
2018 |
3,036 |
|
Colombia |
2018 |
1.520 |
|
Croatia |
2017 |
1,487 |
|
Cyprus |
2019 |
1,000 |
|
Czechia |
2017 |
1,811 |
|
Denmark |
2017 |
3,362 |
|
Ecuador |
2018 |
1,200 |
|
Egypt |
2018 |
1,200 |
|
Estonia |
2018 |
1,304 |
|
Ethiopia |
2020 |
1,230 |
|
Finland |
2017 |
1,199 |
|
France |
2018 |
1,870 |
|
Georgia |
2018 |
2,194 |
|
Germany |
2017, 2018 |
3,698 |
|
Great Britain |
2018 |
1,788 |
|
Greece |
2017 |
1,200 |
|
Guatemala |
2020 |
1,229 |
|
Hong Kong SAR |
2018 |
2,075 |
|
Hungary |
2018 |
1,514 |
|
Iceland |
2017 |
1,624 |
|
Indonesia |
2018 |
3,200 |
|
Iran |
2020 |
1,499 |
|
Iraq |
2018 |
1,200 |
|
Italy |
2018 |
2,277 |
|
Japan |
2019 |
1,353 |
|
Jordan |
2018 |
1,203 |
|
Kazakhstan |
2018 |
1,276 |
|
Kenya |
2021 |
1,266 |
|
Kyrgyzstan |
2020 |
1,200 |
|
Latvia |
2021 |
1,335 |
|
Lebanon |
2018 |
1,200 |
|
Libya |
2022 |
1,196 |
|
Lithuania |
2018 |
1,448 |
|
Macau SAR |
2019 |
1,023 |
|
Malaysia |
2018 |
1,313 |
|
Maldives |
2021 |
1,039 |
|
Mexico |
2018 |
1,741 |
|
Mongolia |
2020 |
1,638 |
|
Montenegro |
2019 |
1,003 |
|
Morocco |
2021 |
1,200 |
|
Myanmar |
2020 |
1,200 |
|
Netherlands |
2017, 2022 |
4,549 |
|
New Zealand |
2020 |
1,057 |
|
Nicaragua |
2020 |
1,200 |
|
Nigeria |
2018 |
1,237 |
|
North Macedonia |
2019 |
1,117 |
|
Norway |
2018 |
1,122 |
|
Pakistan |
2018 |
1,995 |
|
Peru |
2018 |
1,400 |
|
Philippines |
2019 |
1,200 |
|
Poland |
2017 |
1,352 |
|
Portugal |
2020 |
1,215 |
|
Puerto Rico |
2018 |
1,127 |
|
Romania |
2018 |
2,870 |
|
Russia |
2017 |
3,635 |
|
Serbia |
2017, 2018 |
2,545 |
|
Singapore |
2020 |
2,012 |
|
Slovakia |
2017 |
1,432 |
|
Slovenia |
2017 |
1,075 |
|
South Korea |
2018 |
1,245 |
|
Spain |
2017 |
1,209 |
|
Sweden |
2017 |
1,194 |
|
Switzerland |
2017 |
3,174 |
|
Taiwan ROC |
2019 |
1,223 |
|
Tajikistan |
2020 |
1,200 |
|
Thailand |
2018 |
1,500 |
|
Tunisia |
2019 |
1,208 |
|
Turkey |
2018 |
2,415 |
|
Ukraine |
2020 |
2,901 |
|
United States |
2017 |
2,596 |
|
Venezuela |
2021 |
1,190 |
|
Vietnam |
2020 |
1,200 |
|
Zimbabwe |
2020 |
1,215 |
|
Total N = |
2017–2022 |
147,260 |
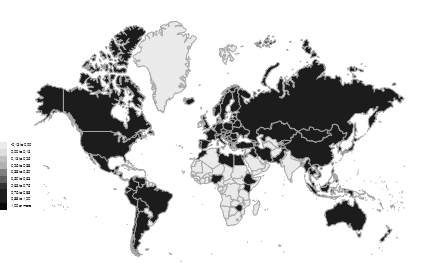
Fig. 1. The global reach of our multivariate models, based on World Values Survey Wave 7 and the European Values Study
Notes: WVS Cross-National Wave 7 spss v4 0.zip.
The identical version of the joint EVS/WVS is accessible through two data service points:
– EVS/GESIS: via the GESIS Data Collection at GESIS – Leibniz Institute for the Social Sciences (data download page).
– WVSA: via the WVS website.
Methodology
Our research attempt is, of course, guided by the vast traditions of mathematical-statistical analysis in opinion survey research (see Tausch, Heshmati, and Karoui 2014; Abdi 2003; Basilevsky 2009; Braithwaite and Law 1985; Brenner 2016; Browne 2001; Fabrigar et al. 1999; Hedges and Olkin 2014; Kline 2014; Knippenberg 2015; McDonald 2014; Mulaik 2009; Suhr 2012; Yeşilada and Noordijk 2010).
Our methodological approach is within a more general framework for studying global values with the methodology of comparative and opinion-sur-vey based political science (Brenner 2016; Knippenberg 2015; Inglehart 2018, 2020). Our methodology for evaluating global public opinion from global surveys is also based on recent advances in mathematical statistical factor analysis (Basilevsky 2009; Hedges and Olkin 2014; Kline 2014; McDonald 2014; Mulaik 2009). Such studies allow projecting the underlying structures of the relationships between the variables.
Our research also uses myriads of cross-national development data and has been written in the well-established tradition of macro-quantitative and time-series development research (see below). We especially mention what can be termed ‘development accounting’ (see Tausch and Heshmati 2012). We project our research results also at the level of choropleth maps.[3]
In general, our entire work firmly shares the established methodology of global values and comparative opinion research (Idem. 2014).
Our main statistical calculations relied on simple cross tables, comparisons of means, bi-variate and partial correlation analyses, factor analysis (oblique factor rotations based on promax factor analysis) (Abdi 2003; Babones 2014; Basilevsky 2009; Browne 2001; Clauß and Ebner 1970; Fabrigar et al. 1999; Hedges and Olkin 2014; Kline 2014; Suhr 2012; Tabachnick and Fidell 2001; for a condensed survey, see also Tausch, Heshmati, and Karoui 2014).
For the algorithm of partial correlation analysis and promax factor analysis, we refer our readers to IBM-SPSS 2014; Hendrickson and White 1964; and Morrison 1976.
Promax Factor Analysis
Concerning factor analysis and the so-called oblique rotation of the factors, which are underlying the correlation matrix, we also refer our readers to important literature on the subject (Abdi 2003; Browne 2001). The IBM-SPSS routine chosen in this context was the so-called promax rotation of factors (Braithwaite and Law 1985; Browne 2001; Fabrigar et al. 1999; Suhr 2012; Yeşilada and Noordijk 2010), which in many ways must be considered to be the best suited rotation of factors in the context of our research today.[4] Formulated in plain everyday language, the mathematical procedures of the rotation of factors which best represent the dimensions underlying a correlation matrix are necessary to make the structure simpler and more reliable.
The problem which factor-analysis solves can be described as follows: can the variables under consideration here be represented in mathematically reduced dimensions, and what percentages of the total reality are thus reprodu-ced, and how are these dimensions related to each other? And what is the relationship of the underlying variables with these dimensions? Is there indeed such a ‘factor’ or ‘dimension’ as religiosity, and how does it affect phenomena like ‘trust in the police’ or ‘Antisemitism’? Is there, apart from it, also something like ‘accepting gender equality’, and something like ‘class’ or ‘status’, which influences ‘trust in the police’ or ‘Antisemitism’, independent from the other ‘factors’? Promax factor analysis is a well-established multivariate and mathematical variety among the general techniques of factor analysis, which extracts the underlying dimensions from the matrix of correlations between the variables and precisely answers the questions just raised above. [5] It was amply described in recent literature (Finch 2006; Tausch, Heshmati, and Karoui 2014). As already stated, Promax factor analysis is the most appropriate technique of factor analysis in public opinion survey studies today (Finch 2006). Factor analysis – in our case promax factor analysis – also allows the researcher to use the mathematical model for the development of a new measurement scale for the new dimensions, derived in the research process (Ibid.). In modern social indicators research, such new scales are called ‘parametric indices’.
In the vast literature, surveyed in Tausch, Heshmati, and Karoui (Ibid.), there are two ways to add together the results from the different components, making up either an UNDP-type of performance Index indicator: simply adding the results together, or first grouping them together to various subcomponents, and only from there to arrive at the results.
Parametric Indicators
But our destabilization indicator is a so-called ‘parametric indicator’, which – in everyday plain language – combines the data with the aim of multivariate statistical analysis (Ibid.). Such a parametric indicator relies on advan-ced statistical methods, such as principal components analysis (Ibid.). Such an analysis extracts an overriding indicator, mathematically best representing the component variables and their correlation matrix. Our parametric index thus relies on the original survey respondents of the survey and calculates the country results, based on principal components factor scores.
Our statistical calculations were performed by the routine and standard IBM-SPSS statistical program (IBM-SPSS XXVIII)[6] and relied on standard partial correlation analyses and factor analysis (Ibid.).[7] Since both our data and the statistical methods used are available around the globe, any researcher can repeat our research exercise with the available open data and should be able to reproduce the same results as we did.
Error Margins
For the calculation of error margins of the representative opinion survey, readers are referred to the easily readable introduction to opinion survey error margins, prepared by Cornell University Roper Center (2017). Readers more interested in the details are also being referred to Langer Research Associates n.d.[8] On the basis of the methodological literature on opinion surveys this website makes available a direct opinion survey error margin calculator. It is important to recall that, for example at a 5 % distrust rate in the police, error margins for our chosen samples of around 1,000 representative interview partners for each country are ±1.4 %. A 10 % distrust rate, the error margin is ±1.9 %: and at a distrust rate of 15 % the error margin is ±2.2 % (see Langer Research Associates n.d.). That error margins differ according to reported rates of, say, distrust in the police, is an important fact of opinion survey research theory, often forgotten to be mentioned in the public debate.
In line with standard traditions of empirical opinion survey research (Tausch, Heshmati, and Karoui 2014), for all analyzed groups and sub-groups, a minimum sample size of at least 30 respondents in each country had to be available in order to make reasonable predictions (Clauß and Ebner 1970).
Table 2. Maximum ranges of variation for survey results (the probability of error is 5 %)
|
Sample
|
Maximum
|
Maximum
|
Maximum
|
Maximum
|
Maximum
|
|
N |
10 % or 90 % |
20 % or 80 % |
30 % or 70 % |
40 % or 60 % |
50 % |
|
20 |
13.1 % |
17.5 % |
20.1 % |
21.5 % |
21.9 % |
|
30 |
10.7 % |
14.3 % |
16.4 % |
17.5 % |
17.9 % |
|
40 |
9.3 % |
12.4 % |
14.2 % |
15.2 % |
15.5 % |
|
50 |
8.3 % |
11.1 % |
12.7 % |
13.6 % |
13.9 % |
|
75 |
6.8 % |
9.1 % |
10.4 % |
11.1 % |
11.3 % |
|
100 |
5.9 % |
7.8 % |
9.0 % |
9.6 % |
9.8 % |
|
250 |
3.7 % |
5.0 % |
5.7 % |
6.1 % |
6.2 % |
|
500 |
2.6 % |
3.5 % |
4.0 % |
4.3 % |
4.4 % |
|
1,000 |
1.9 % |
2.5 % |
2.8 % |
3.0 % |
3.1 % |
|
2,000 |
1.3 % |
1.8 % |
2.0 % |
2.1 % |
2.2 % |
Dimensions and Variables from the World Values Survey and European Values Survey
As we already stated above, in our factor analytical model, we used the following dimensions from our multivariate data:
(1) The importance of friends, leisure, politics, work, religion in life.
(2) Happiness, health, life satisfaction.
(3) Important child characteristics: hard work, tolerance and respect for other people, religious belief.
(4) Xenophobic attitudes
towards people of a different race, immigrants/
foreign workers.
(5) Membership: Belonging to conservation, the environment, ecology, animal rights.
(6) Acceptance of women as political leaders, in higher education, as business leaders.
(7) Willingness to fight for the country.
(8) We need greater income differences.
(9) Private vs. public ownership of business.
(10) Good or bad competition.
(11) Trust: Press, trade unions, parliament, civil service, political parties, big business, environmental movement.
(12) Perceptions of main roles of democracy: tax the rich, religious authorities interpret the laws, choose leaders in free elections, state aid for unemployment, civil rights protect people's freedom, women have the same rights as men, the state equalizes people's incomes, people obey their rulers.
(13) Never attend religious services.
(14) Justifiable: Claiming government benefits to which you are not entitled, cheating on taxes, accepting a bribe, abortion, divorce, euthanasia, suicide, political violence, capital punishment.
(15) Gender: female.
(16) Year of birth.
(17) Highest level of education attained.
These dimensions were represented by the following variables:
· Not important in life: Friends;
· Not important in life: Leisure time;
· Not important in life: Politics;
· Not important in life: Work;
· Not important in life: Religion;
· Feeling of unhappiness;
· State of health bad (subjective);
· Satisfaction with your life;
· Important child qualities: hard work;
· Important child qualities: tolerance and respect for other people;
· Important child qualities: religious faith;
· Membership: Belonging to conservation, the environment, ecology, animal rights;
· Reject neighbours: People of a different race;
· Reject neighbours: Immigrants/foreign workers;
· Men do not make better political leaders than women do;
· University is not more important for a boy than for a girl;
· Men do not make better business executives than women do;
· Willingness to fight for country;
· We need larger income differences;
· Private vs state ownership of business;
· Competition good or harmful;
· No confidence: The Press;
· No confidence: Labour Unions;
· No confidence: Parliament;
· No confidence: The Civil Services;
· No confidence: The Political Parties;
· No confidence: Major Companies;
· No confidence: The Environmental Protection Movement;
· Democracy: Governments tax the rich and subsidize the poor;
· Democracy: Religious authorities interpret the laws;
· Democracy: People choose their leaders in free elections;
· Democracy: People receive state aid for unemployment;
· Democracy: Civil rights protect people's liberty against oppression;
· Democracy: Women have the same rights as men;
· Democracy: The state makes people's incomes equal;
· Democracy: People obey their rulers;
· Never attend religious services;
· Justifiable: Claiming government benefits to which you are not entitled;
· Justifiable: Cheating on taxes;
· Justifiable: Someone accepting a bribe;
· Justifiable: Abortion;
· Justifiable: Divorce;
· Justifiable: Euthanasia;
· Justifiable: Suicide;
· Justifiable: Political violence;
· Justifiable: Death penalty;
· Gender: female;
· Year of birth;
· Highest educational level attained – Respondent: ISCED‐code one digit.
Cross-National Data
In the explanation of the dependent variables due emphasis was also given to dependency and world system approaches to development, which received large-scale empirical confirmation (see Bornschier 1980, 1983; Bornschier and Ballmer-Cao 1979; Bornschier and Chase-Dunn 1985; Tausch and Heshmati 2012). Earlier, well-known datasets for these investigations were:
· Ballmer-Cao Scheidegger (1979);
· Müller and Bornschier (1988);
· Tausch (2012)[9].
More recent databases, integrating dependency and world system approaches with conventional economic theories and the sociology of world values research are:
· Tausch (2019)[10];
· Tausch and Heshmati (2012)[11].
The present dataset, which we used in our analysis, is available in EXCEL format data[12].
Results from the World Values Survey
and European Values Survey
Table 3 and Fig. 2 clearly show the rising tide of environmental movements in the Global South, directly contradicting many of the prognoses of previous World Values Survey research.
Table 3. Membership: Belonging to conservation, the environment, ecology, animal rights (0 = 0 %; 1.0 = 100 %)
|
|
Membership:
|
N |
|
Kenya |
0.394 |
1,203 |
|
Indonesia |
0.349 |
3,188 |
|
Colombia |
0.346 |
1,520 |
|
Thailand |
0.320 |
1,500 |
|
Guatemala |
0.263 |
1,192 |
|
Malaysia |
0.263 |
1,313 |
|
Nicaragua |
0.256 |
1,200 |
|
Libya |
0.234 |
1,170 |
|
Ethiopia |
0.220 |
1,216 |
|
Mongolia |
0.218 |
1,638 |
|
Morocco |
0.218 |
1,200 |
|
Tajikistan |
0.216 |
1,200 |
|
Nigeria |
0.210 |
1,211 |
|
Switzerland |
0.206 |
3,142 |
|
United States |
0.196 |
2,573 |
|
Zimbabwe |
0.191 |
1,205 |
|
New Zealand |
0.181 |
982 |
|
Philippines |
0.174 |
1,199 |
|
Pakistan |
0.173 |
1,796 |
|
Netherlands |
0.172 |
4,385 |
|
Hong Kong SAR |
0.166 |
2,075 |
|
Puerto Rico |
0.165 |
1,127 |
|
Taiwan ROC |
0.164 |
1,223 |
|
Australia |
0.157 |
1,781 |
|
Mexico |
0.155 |
1,738 |
|
Chile |
0.154 |
1,000 |
|
Bolivia |
0.152 |
2,045 |
|
Canada |
0.150 |
4,018 |
|
Cyprus |
0.146 |
984 |
|
Denmark |
0.144 |
3,349 |
|
Sweden |
0.142 |
1,177 |
|
Slovenia |
0.138 |
1,071 |
|
Iran |
0.128 |
1,497 |
|
Czechia |
0.125 |
1,554 |
|
Ecuador |
0.122 |
1,186 |
|
Iceland |
0.122 |
1,616 |
|
North Macedonia |
0.115 |
1,092 |
|
Macau SAR |
0.103 |
1,017 |
|
Iraq |
0.102 |
1,164 |
|
Germany |
0.100 |
3,635 |
|
Great Britain |
0.086 |
1,787 |
|
Finland |
0.079 |
1,178 |
|
Argentina |
0.070 |
1,003 |
|
Norway |
0.066 |
1,122 |
|
Maldives |
0.061 |
1,012 |
|
Myanmar |
0.060 |
1,200 |
|
Croatia |
0.058 |
1,427 |
|
Tunisia |
0.058 |
1,174 |
|
Ukraine |
0.058 |
2,820 |
|
Serbia |
0.053 |
2,391 |
|
Bangladesh |
0.051 |
1,173 |
|
South Korea |
0.051 |
1,245 |
|
Turkey |
0.051 |
2,371 |
|
Romania |
0.050 |
2,741 |
|
Venezuela |
0.050 |
1,190 |
|
Peru |
0.049 |
1,389 |
|
Singapore |
0.049 |
2,004 |
|
Spain |
0.049 |
1,201 |
|
France |
0.047 |
1,868 |
|
Hungary |
0.046 |
1,512 |
|
Kazakhstan |
0.043 |
1,196 |
|
Lebanon |
0.043 |
1,200 |
|
Austria |
0.040 |
1,637 |
|
China |
0.039 |
3023 |
|
Armenia |
0.038 |
2,716 |
|
Brazil |
0.037 |
1,719 |
|
Vietnam |
0.037 |
1,200 |
|
Andorra |
0.036 |
1,002 |
|
Greece |
0.035 |
1,199 |
|
Jordan |
0.035 |
1,160 |
|
Kyrgyzstan |
0.032 |
1,194 |
|
Bulgaria |
0.031 |
1,435 |
|
Bosnia and Herzegovina |
0.028 |
1,696 |
|
Latvia |
0.028 |
1,332 |
|
Montenegro |
0.027 |
997 |
|
Italy |
0.026 |
2,249 |
|
Poland |
0.022 |
1,346 |
|
Georgia |
0.018 |
2,178 |
|
Albania |
0.017 |
1,435 |
|
Lithuania |
0.016 |
1,413 |
|
Estonia |
0.014 |
1,304 |
|
Japan |
0.014 |
1,336 |
|
Russia |
0.014 |
3,585 |
|
Slovakia |
0.010 |
1,411 |
|
Belarus |
0.009 |
1,548 |
|
Portugal |
0.009 |
1,188 |
|
Azerbaijan |
0.005 |
1,775 |
|
Egypt |
0.005 |
1,199 |
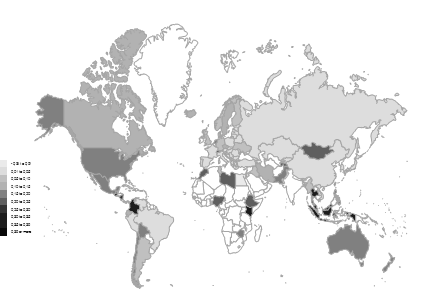
Fig. 2. Membership in the environmental movement
Table 4 and Fig. 3 indicate high confidence in the environmental movement in many countries and territories of the Global South, especially in East and Southeast Asia. In general terms, trust in the environmental movement is the lowest in some Arab countries, in Southeastern and Eastern Europe, and in some countries of Latin America and the Carribean.
Table 4. Confidence in the environmental movement (0 = 0 %; 1.0 = 100 %)
|
|
A great deal |
Quite a lot |
A great deal + quite a lot |
N |
|
Vietnam |
0.177 |
0.719 |
0.896 |
1,162 |
|
China |
0.152 |
0.663 |
0.815 |
3,016 |
|
Myanmar |
0.323 |
0.484 |
0.807 |
1,200 |
|
Indonesia |
0.281 |
0.516 |
0.797 |
3,173 |
|
Philippines |
0.309 |
0.480 |
0.789 |
1,199 |
|
Malaysia |
0.180 |
0.595 |
0.775 |
1,310 |
|
Iran |
0.263 |
0.501 |
0.764 |
1,474 |
|
Macau SAR |
0.106 |
0.636 |
0.742 |
1,016 |
|
Singapore |
0.107 |
0.615 |
0.722 |
1,750 |
|
Taiwan ROC |
0.126 |
0.589 |
0.715 |
1,207 |
|
Ethiopia |
0.234 |
0.481 |
0.715 |
1,147 |
|
Great Britain |
0.118 |
0.587 |
0.705 |
1,734 |
|
Sweden |
0.117 |
0.584 |
0.701 |
1,160 |
|
Thailand |
0.196 |
0.493 |
0.689 |
1,127 |
|
Andorra |
0.088 |
0.601 |
0.689 |
994 |
|
Puerto Rico |
0.344 |
0.335 |
0.679 |
1,113 |
|
Iceland |
0.102 |
0.561 |
0.663 |
1,566 |
|
Estonia |
0.090 |
0.571 |
0.661 |
1,115 |
|
Latvia |
0.056 |
0.598 |
0.654 |
1,250 |
|
Kyrgyzstan |
0.144 |
0.508 |
0.652 |
1,133 |
|
South Korea |
0.057 |
0.591 |
0.648 |
1,245 |
|
Bangladesh |
0.172 |
0.476 |
0.648 |
1,081 |
|
Zimbabwe |
0.214 |
0.429 |
0.643 |
1,175 |
|
Germany |
0.086 |
0.556 |
0.642 |
3,477 |
|
France |
0.087 |
0.554 |
0.641 |
1,779 |
|
Switzerland |
0.072 |
0.567 |
0.639 |
3,124 |
|
New Zealand |
0.089 |
0.546 |
0.635 |
953 |
|
Ecuador |
0.198 |
0.434 |
0.632 |
1,190 |
|
Brazil |
0.173 |
0.454 |
0.627 |
1,575 |
|
Spain |
0.131 |
0.494 |
0.625 |
1,159 |
|
Kenya |
0.272 |
0.349 |
0.621 |
1,237 |
|
Canada |
0.100 |
0.519 |
0.619 |
4,018 |
|
Portugal |
0.071 |
0.548 |
0.619 |
1,107 |
|
Hong Kong SAR |
0.085 |
0.533 |
0.618 |
2,057 |
|
Denmark |
0.083 |
0.534 |
0.617 |
3,277 |
|
Austria |
0.131 |
0.482 |
0.613 |
1,596 |
|
Lithuania |
0.037 |
0.576 |
0.613 |
1,226 |
|
Belarus |
0.110 |
0.502 |
0.612 |
1,366 |
|
Kazakhstan |
0.159 |
0,452 |
0.611 |
1,193 |
|
Tajikistan |
0.250 |
0.360 |
0.610 |
1,048 |
|
Slovakia |
0.061 |
0.548 |
0.609 |
1,338 |
|
Maldives |
0.191 |
0.414 |
0.605 |
1,025 |
|
Pakistan |
0.224 |
0.378 |
0.602 |
1,734 |
|
Chile |
0.178 |
0.423 |
0.601 |
971 |
|
Argentina |
0.135 |
0.462 |
0.597 |
865 |
|
Italy |
0.106 |
0.491 |
0.597 |
2,169 |
|
Australia |
0.095 |
0.501 |
0.596 |
1,788 |
|
Norway |
0.090 |
0.504 |
0.594 |
1,103 |
|
Cyprus |
0.109 |
0.479 |
0.588 |
890 |
|
Azerbaijan |
0.097 |
0.487 |
0.584 |
1,523 |
|
Nigeria |
0.190 |
0.377 |
0.567 |
1,211 |
|
Turkey |
0.088 |
0.472 |
0.560 |
2,285 |
|
Hungary |
0.114 |
0.443 |
0.557 |
1,419 |
|
Nicaragua |
0.253 |
0.304 |
0.557 |
1,200 |
|
United States |
0.116 |
0.434 |
0.550 |
2,565 |
|
Finland |
0.055 |
0.491 |
0.546 |
1,160 |
|
Japan |
0.052 |
0.486 |
0.538 |
1,109 |
|
Russia |
0.112 |
0.413 |
0.525 |
3,201 |
|
Netherlands |
0.056 |
0.468 |
0.524 |
4,118 |
|
Slovenia |
0.069 |
0.441 |
0.510 |
1,031 |
|
Georgia |
0.113 |
0.386 |
0.499 |
2,035 |
|
Poland |
0.077 |
0.400 |
0.477 |
1,207 |
|
Bolivia |
0.164 |
0.302 |
0.466 |
1,950 |
|
Greece |
0.046 |
0.420 |
0.466 |
1,134 |
|
Jordan |
0.137 |
0.328 |
0.465 |
879 |
|
Colombia |
0.226 |
0.234 |
0.460 |
1,520 |
|
Venezuela |
0.092 |
0.366 |
0.458 |
1,190 |
|
Morocco |
0.090 |
0.352 |
0.442 |
1,200 |
|
Peru |
0.100 |
0.336 |
0.436 |
1,323 |
|
North Macedonia |
0.085 |
0.349 |
0.434 |
1,060 |
|
Ukraine |
0.046 |
0.387 |
0.433 |
2,520 |
|
Armenia |
0.069 |
0.357 |
0.426 |
2,496 |
|
Mongolia |
0.096 |
0.319 |
0.415 |
1,498 |
|
Bosnia and Herzegovina |
0.075 |
0.326 |
0.401 |
1,673 |
|
Montenegro |
0.061 |
0.338 |
0.399 |
958 |
|
Romania |
0.096 |
0.302 |
0.398 |
2,562 |
|
Guatemala |
0.093 |
0.281 |
0.374 |
1,229 |
|
Mexico |
0.126 |
0.245 |
0.371 |
1,696 |
|
Tunisia |
0.174 |
0.194 |
0.368 |
1,003 |
|
Croatia |
0.048 |
0.309 |
0.357 |
1,426 |
|
Iraq |
0.137 |
0.188 |
0.325 |
1,053 |
|
Albania |
0.062 |
0.260 |
0.322 |
1,345 |
|
Serbia |
0.059 |
0.262 |
0.321 |
2,373 |
|
Czechia |
0.048 |
0.266 |
0.314 |
1,622 |
|
Libya |
0.078 |
0.206 |
0.284 |
1,054 |
|
Bulgaria |
0.025 |
0.253 |
0.278 |
1,359 |
|
Lebanon |
0.063 |
0.159 |
0.222 |
1,164 |
|
Egypt |
0.009 |
0.140 |
0.149 |
681 |
![]()
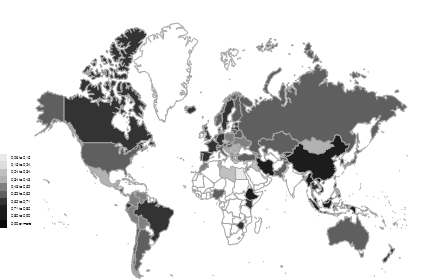
Fig. 3. Trust in the environmental movement
What is Trust? Results from the World Values Survey
and European Values Survey
In our multivariate analyses, we
first analyzed the different indicators of trust using a simple principal
component analysis, which explains 51.144 %
of the variance.
Clearly, there are variables associated with distrust in democratic
institutions, and there are variables associated with distrust in the army and
religious institutions. Table 5 shows the factor loadings and Table 6 lists the
countries of the world ranked by the absence of distrust in democratic
institutions. Again, many countries in the Global South, particularly in East
and South-East Asia, are at the top.
Table 5. The different dimensions of trust – principal component analy sis from World Values Survey and European Values Survey data
|
|
Distrust in democratic |
Distrust in the army |
|
No Confidence: Churches |
0.365 |
0.591 |
|
No Confidence:Armed Forces |
0.523 |
0.633 |
|
No Confidence: the Press |
0.619 |
–0.007 |
|
No Confidence: Labour Unions |
0.654 |
–0.117 |
|
No Confidence: the Police |
0.660 |
0.239 |
|
No Confidence: Parliament |
0.795 |
–0.113 |
|
No Confidence: the Civil Services |
0.753 |
–0.062 |
|
No Confidence: the Government |
0.768 |
–0.015 |
|
No Confidence: the Political |
0.743 |
–0.150 |
|
No Confidence: Major Companies |
0.618 |
–0.129 |
|
No Confidence: the Environmental Protection Movement |
0.588 |
–0.286 |
|
No Confidence: Justice System/Courts |
0.741 |
0.057 |
|
No Confidence: the United Nations |
0.586 |
–0.270 |
Table 6. Factor scores of trust in the world system
|
Country |
Distrust in democratic institutions |
Distrust in the army |
|
Vietnam |
–1.278 |
0.305 |
|
Tajikistan |
–1.208 |
–0.143 |
|
Philippines |
–0.971 |
–0.137 |
|
Bangladesh |
–0.916 |
–0.412 |
|
Indonesia |
–0.779 |
–0.593 |
|
Kazakhstan |
–0.739 |
–0.081 |
|
Myanmar |
–0.724 |
0.994 |
|
Azerbaijan |
–0.715 |
–0.488 |
|
Singapore |
–0.678 |
0.142 |
|
Norway |
–0.629 |
0.283 |
|
Macau SAR |
–0.602 |
0.536 |
|
Iran |
–0.573 |
–0.624 |
|
Thailand |
–0.508 |
0.389 |
|
Pakistan |
–0.498 |
–0.899 |
|
Turkey |
–0.485 |
–0.451 |
|
Sweden |
–0.436 |
0.537 |
|
Denmark |
–0.403 |
0.067 |
|
Malaysia |
–0.398 |
–0.037 |
|
Ethiopia |
–0.388 |
–0.364 |
|
Finland |
–0.387 |
–0.319 |
|
Kenya |
–0.277 |
0.082 |
|
New Zealand |
–0.264 |
–0.017 |
|
Japan |
–0.262 |
0.396 |
|
Switzerland |
–0.234 |
0.509 |
|
Austria |
–0.200 |
0.299 |
|
Hong Kong SAR |
–0.190 |
0.397 |
|
Zimbabwe |
–0.190 |
0.352 |
|
Kyrgyzstan |
–0.186 |
0.049 |
|
Portugal |
–0.174 |
–0.061 |
|
Nigeria |
–0.174 |
0.042 |
|
Canada |
–0.167 |
0.284 |
|
Taiwan ROC |
–0.164 |
0.229 |
|
Estonia |
–0.153 |
0.256 |
|
Belarus |
–0.146 |
0.180 |
|
Lithuania |
–0.137 |
–0.097 |
|
South Korea |
–0.121 |
0.481 |
|
Germany |
–0.097 |
0.452 |
|
Great Britain |
–0.095 |
–0.009 |
|
Australia |
–0.012 |
–0.015 |
|
Netherlands |
–0.010 |
0.525 |
|
Slovakia |
0.000 |
0.204 |
|
Russia |
0.007 |
–0.266 |
|
Latvia |
0.010 |
0.090 |
|
Jordan |
0.027 |
–1.458 |
|
France |
0.038 |
0.071 |
|
Cyprus |
0.062 |
–0.066 |
|
Georgia |
0.087 |
–0.515 |
|
United States |
0.094 |
–0.200 |
|
Italy |
0.096 |
–0.037 |
|
Mongolia |
0.123 |
0.601 |
|
Hungary |
0.130 |
0.271 |
|
Spain |
0.130 |
0.490 |
|
Maldives |
0.133 |
–0.372 |
|
Montenegro |
0.148 |
–0.137 |
|
Chile |
0.239 |
0.522 |
|
Poland |
0.270 |
–0.085 |
|
Ecuador |
0.271 |
–0.232 |
|
Morocco |
0.300 |
–0.271 |
|
Ukraine |
0.330 |
–0.134 |
|
Brazil |
0.331 |
–0.019 |
|
Armenia |
0.343 |
–0.503 |
|
North Macedonia |
0.369 |
–0.160 |
|
Romania |
0.381 |
–0.544 |
|
Greece |
0.384 |
–0.647 |
|
Puerto Rico |
0.411 |
–0.147 |
|
Slovenia |
0.441 |
0.407 |
|
Iraq |
0.448 |
–0.702 |
|
Bosnia and Herzegovina |
0.512 |
–0.078 |
|
Czechia |
0.512 |
0.418 |
|
Lebanon |
0.516 |
–0.898 |
|
Colombia |
0.566 |
0.075 |
|
Argentina |
0.578 |
0.404 |
|
Libya |
0.601 |
–0.869 |
|
Bulgaria |
0.603 |
0.340 |
|
Nicaragua |
0.639 |
0.290 |
|
Tunisia |
0.657 |
–0.609 |
|
Serbia |
0.663 |
–0.256 |
|
Bolivia |
0.668 |
0.395 |
|
Albania |
0.686 |
–0.168 |
|
Mexico |
0.808 |
–0.138 |
|
Guatemala |
0.822 |
0.045 |
|
Venezuela |
0.845 |
0.290 |
|
Croatia |
0.847 |
0.031 |
|
Peru |
0.977 |
0.083 |
[1] See URL: https://www.sciencedirect.com/topics/economics-econometrics-and-finance/environmental-kuznets-curve.
[2] URL: https://www.worldvaluessurvey.org/WVSDocumentationWV7.jsp.
[3] The choropleth maps of this book were drawn using the free software developed by Robert Mundigl (see URL: https://www.clearlyandsimply.com/).
[4] Older approaches often assumed that there is no correlation between the factors, best representing the underlying dimensions of the variables. But, e.g., in attempting to understand the pro-Brexit vote in the United Kingdom it would be ridiculous to assume that, say, there is no correlation between anti-immigration attitudes and the feeling to be among the losers of globalization.
[5] The mathematical algorithm is described at URL: https://www.ibm.com/support/knowledgecenter/en/SSLVMB_22.0.0/com.ibm.spss.statistics.algorithms/alg_.... Interested readers are also referred to materials used at the University of Texas in Dallas, available at
URL: https://www.utdallas.edu/~herve/Abdi-rotations-pretty.pdf.
[6] URL: https://www-01.ibm.com/software/at/analytics/spss/.
[7] URL: https://www.ibm.com/analytics/spss-statistics-software.
[8] URL: https://www.langerresearch.com/moe/.
[9] Free download available at URL: http://www.uni-corvinus.hu/index.php?id=47854&tx_ttnews%5Btt_news%5D=0&tx_ttnews....
[10] See URL: http://jcpa.org/article/migration-from-the-muslim-world-to-the-west-its-most-recent-trends-and-effec... (with data definitions and sources). Free data download available at URL: https://www.academia.edu/37568941/Migration_from_the_Muslim_World_to_the_West_Its_Most_Recent_Trends....
[11] Free data download available at URL: https://www.academia.edu/35044095/Globalization_the_human_condition_and_sustainable_development_in_t....
[12] See URL: https://www.researchgate.net/publication/368810044_RESILIENCE_2023_EXCEL_DATA_PUBLIC_ACCESS_for_the_....