World Intellectual Capital Circulation: Brain Drain, High-Tech Products and Export of Technologies
скачать Авторы:
- Vladimir S. Osipov - подписаться на статьи автора
- Aleksandr P. Tsypin - подписаться на статьи автора
- Ilyin, Ilya V. - подписаться на статьи автора
- Andreev, Aleksey - подписаться на статьи автора
Журнал: Journal of Globalization Studies. Volume 15, Number 1 / May 2024 - подписаться на статьи журнала
DOI: https://doi.org/10.30884/jogs/2024.01.08
Vladimir S. Osipov, Lomonosov Moscow State University, Moscow, Russia
Aleksandr P. Tsypin, Financial University under the Government of the Russian Federation, Moscow, Russia
Ilya V. Ilyin, Lomonosov Moscow State University, Moscow, Russia
Aleksey I. Andreev, Lomonosov Moscow State University, Moscow, Russia
The purpose of the present research is to reveal the global structure of intellectual capital flows, in which upstream emigration of scientists and researchers from donor countries enriches the intellectual capital and potential of the recipient countries, while intellectual products and technologies from recipient countries go downstream to donor countries. The research uses expert judgement to collect data. Institutional and comparative analyses are used to explain the structure of intellectual capital flows and to identify the reasons for the upstream emigration of intellectual capital and the downstream export of intellectual products. Econometric methods are used to explain the relationships between indices and scores. We reveal that all countries can be conditionally divided into two categories, namely donors and recipients of human intellectual capital. Donors supply scientists and researchers to recipient countries, and recipient countries supply high-tech products to donors. This situation is not only justified from the perspective of the international division of labor, but is also beneficial for both donor and recipient countries, as donors receive the necessary technology from recipients, and recipients replenish their need for scientists to create high-tech products. This constant circulation leads to the further impoverishment of developing countries, while at the same time becoming the basis for the enrichment of highly developed countries. According to the results of the study, we can conclude that three main characteristics act as factors to describe the global flows of intellectual capital:
1. As recipient countries offer better living and working conditions, higher wages and more secure human rights, the outflow of scientists from donor countries seems to be a natural phenomenon.
2. Research shows that donor countries lack the demand for scientists and their development, as these countries receive high technologies and products from recipient countries, which means that donor countries' policy is aimed at reducing their funding for science.
3. On the contrary, the demand for scientists in recipient countries is growing as high-tech products become the main export commodity. Recipient countries of intellectual human capital have no other export opportunities – they are poor in minerals and the high-tech sector is the only way to balance the country's payments.
Keywords: intellectual capital, emigration of scientists, high-tech export, brain drain, IT-objects.
1. Introduction
Intellectual capital includes the knowledge and skills of intellectual human resources, as well as such intangible assets such as data sets and databases, patents, software, commercial know-how etc. The basis of intellectual capital is the human resources engaged in intellectual work and the results of that work. In other words, intellectual capital is the result of mental processes that form a set of intangible objects that can be used in economic activity and generate income to its owner (the organization), including the competencies of people (human capital), the value of relations (relational capital) and everything that is left over when the employees go home (structural capital) (Edvinsson et al. 1997).
In recent years, according to the search conducted by the author of this article in the Scopus database, 300–400 works related in one way or another to artificial intelligence have been published, annually. The most important works on this topic are concentrated in specialized journals on intellectual capital (Bamel et al. 2022). In a review study in 2021, it is noted that the study of intellectual capital has been conducted for more than 70 years, that since 2015 there has been an increase in the annual number of publications on this topic, and that along with traditional measures of intellectual capital by its main components, there are new research trends focusing on the relationship of intellectual capital to scientific and technological productivity and on issues of knowledge management and innovation (Quintero-Quintero et al. 2021, Ali et al. 2021). At the same time, it is rightly noted that one of the problems of global development is the outflow of intellectual capital from the economies and education systems of the most developed countries of the Global South (Khakhuk et al. 2021).
In the context of global inequality, not all countries can create the conditions for the realization of the creative potential of those who strive for knowledge and innovation. Naturally, some of the highly skilled labor force will migrate to more prosperous countries, where intellectual migrants can improve their competencies, obtain a sufficiently high level of quality of life and work, and realize their professional potential. In this way, the economies of the developed countries will be able to maintain their leading positions, while the developing countries will lag behind even more – as a result of the loss of intellectual human resources, the key component of intellectual capital. At the same time, in many cases they will consume the intellectual products of the leading countries rather than producing their own. Thus, the flows of intellectual human resources and the products of intellectual activity tend to move in opposite directions, exacerbating global inequality. The UNESCO Science Report 2021 notes that the phenomenon of ‘brain drain’ remains ‘a chronic problem in many countries with low or stagnating research expenditure,’ which is typical for the countries of Central Asia and South-east Europe (UNESCO report). The international division of labor is driving the service and high-tech industries to increase inequality in international competition in the globalized market (Reinert 2007).
Recent data suggest that the proportion of foreigners among doctoral graduates in the United States is growing, accounting for one-third of the total number of new PhDs in 2020. The proportion of foreigners with PhDs in science and technology who stay in the United States for at least five years after graduation has risen to its highest level at around 70 per cent. The majority of foreign PhDs in science and engineering from US institutions come from China and India. Students from these two countries had the highest proportions of those who stayed for at least five years (84 per cent and 85 per cent respectively) and for at least ten years (86 per cent for both countries) (Finn and Pennington 2018).
However, in some other respects, inequality may decrease (see, e.g., Korotayev et al. 2015). Indeed, many intellectuals return to their home countries, and, enriched with modern skills and experience in working with high technologies, use their professional skills in their home countries, contributing to economic growth. This has been the case in Japan, South Korea, China and India.
Financial services and high-tech exports play an important role in the economies of developed countries. In this paper, we will look at high-tech products and information technologies together, called IT-objects. IT objects include both tangible items and intangible content based on high technologies and created to improve production efficiency and human well-being. IT objects include automata, robots, artificial intelligence, various gadgets, etc. With the emergence of the digital Industry 4.0, the question of the relationship between the global flows of intellectual personnel and the products of intellectual activity takes on a new meaning, as it is no longer necessary to work physically in a developed economy in order to rely on its high-tech base. At the same time, by analyzing the cross-border flows of intellectual human resources and IT products, one can assess the validity of the statement about the ‘harmfulness’ of intellectual migration to overcoming global inequality and its role in achieving the Sustainable Development Goals. Intellectual human capital is a major object of international competition and recipient countries create various conditions to attract as many researchers and scientists as possible from low-income donor countries. These conditions require specific institutional policies, ranging from migration procedures and living conditions to salaries and career opportunities.
The main objective of our research is to provide the evidence for three main tasks:
(1) to determine the directions of outflows of human intellectual capital in the modern world from donor countries to recipient countries;
(2) to determine the directions of export inflows of IT-objects from intellectual capital recipient countries to donor countries;
(3) to model the conjugation of the flows of world population migration, specialization in export-import of IT objects and financial results of the use of intellectual property in the world with the definition of countries specializing in high-tech export and import.
2. Literature Review
The term ‘intellectual capital’ was first used in 1925 (Judd 1925) and has become widespread in the second half of the twentieth century.
Intellectual capital has its own very specific pattern of circulation around the world. The term ‘brain drain’ is also widely used (with almost 3,000 publications on this phenomenon in Scopus since 1964) (Greenberg 1964). At the same time, there is also a lot of research on ‘brain circulation’ or ‘intellectual migration’ (one of the first works – Khoshkish 1966).
There is an ongoing debate as to whether the outflow of highly skilled labor should be viewed positively or negatively. The main theoretical basis for the study of human capital flows goes back at least to John Hicks (1963 [1932]), who noted that differences in net economic benefits, mainly in wages, are the main causes of migration. In the 1950s – 1980s, researchers reached a consensus that recipient countries have benefits, while countries of origin lose human capital and thus may experience negative impact of the emigration of high-skilled workforce (Bhagwati and Hamada 1974). Since the 1990s, a growing literature has discussed the positive effects of the outflow of highly skilled labor, arguing that under certain circumstances a brain drain may ultimately benefit the country of origin, taking into account various fiscal and technological externalities which underpinned the pessimistic models of the 1970s. The outflow of highly skilled workers can create a diaspora abroad that fosters trade between sending and diaspora countries (Rauch and Trindale 2002).
The problem of emigration of researchers and scientists from their home countries to other countries is largely related to the tragedies of the twentieth century. The two World Wars, the revolutions and collapses of the German, Austro-Hungarian, Ottoman, and Russian empires, fascism and communist dictatorship all contributed to the movement of scientists between countries. The last major catastrophe of the twentieth century, the collapse of the Soviet Union and most communist political systems, made life difficult for researchers. Cervantes and Guellec (2002) explain the characteristics of brain drain in the new reality. Emigration was the only way to improve the life of researchers. Brain drain as a global political process within the international labor division theory can be explained by dividing all countries into two groups – recipients and donors of intellectual human capital. As Bhagwati and Hamada (1974) note, brain drain contributes to the integration of international markets, especially capital and labor markets. Recipient countries get an opportunity to increase their intellectual potential, as Stark, Helmenstein, and Prskawetz (1997) show in their famous paper. For recipient countries, the migration of scientists is an inflow of talent, as Carr, Inkson, and Thorn (2005) point out. Some authors study the migration of scientists in particular regions of the world, such as Africa (Hagopian et al. 2004), East Asia (Chang 1992), China and India (Saxenian 2005), Russia (Iontsev, Ryazantsev, Iontseva 2016, Ryasantsev and Pismennaya 2013, Khramova and Ryazantsev 2018, Ryazantsev 2018), Chile and Peru (Heredia Pérez et al. 2019), Italy (Matricano 2020), and in specific scientific fields such as physics or healthcare (Pang, Lansang, and Haines 2002), or among highly qualified professionals in general (Iredale 2001). Min, Kim and Sawng (2020), and Silva, Venancio, Silva, and Goncalves (2020) make important contribution to the research of the modern impact of human capital on innovation processes.
The research and experience of Sergey Ryazantsev is very important for understanding the problem of Russia' brain drain, where intellectual human capital outflows to recipient countries, and large quantities of high-tech products are imported.
The outflow of intellectual human capital and its impact on economic growth has been extensively studied by Andrew Mountford (1997), Michel Beine, Frederic Docquier, and Hillel Rapoport (2001, 2008), Fred Phillips and Deog-Seong Oh (2016), Docquier and Rapoport (2012), Oded Galor and Daniel Tsiddon (1994, 1997), Nadeem Haque and Se-Jik Kim (1995), Carl Benedikt Frey and Michael A. Osborne (2017), Bjorn Lomborg (2020), Ross Gruetzemacher, Davud Paradice, Lee Kang Bok (2020), Maksim Belitski, Anna Aginskaja, and Radzivon Marozau (2019), Barbara Beham, Andreas Baierl, and Janin Eckner (2020), Enrique Bigne (2020), Tarique Mahmood and Muhammad Shujaat Mubarik (2020), and others.
The strategic role of intellectual capital and the need to attract it is described in the research of Dabic et al. (2020), Choi, Ravichandran, O’Connor (2019), Rangus, Černe (2019), Kuo, Wu, Lin (2019), Fassio, Montobbio, Venturini (2019), Cui, Xiao (2019), Ozer, Zhang (2019), Ortiz-Gallardo et al. (2014). Wagner, Whetsell, and Mukherjee (2019) made a significant research on international cooperation for gaining new knowledge. The inter-regional innovation cooperation network was in the focus of research by Chinese authors Pan et al. (2020). It would be impossible to conduct a research without survey of digitalization as a driver of new levels of human well-being (Torres, Augusto 2020). The application of the brain drain problem could be found in the convergence of industries according to digitalization and new technologies, where the research of Sick et al. (2019) is particularly important.
Vidal (1998), in his famous work, shows the effects of emigration on the economy and on the formation of intellectual human capital as a demographic process.
The positive influence of the inflow of intellectual human capital is described by Inkson et al. (2004) and McCallum (2006) with specific reference to the globalization process.
The interrelation between political and economic factors of emigration is described by Lam (2002), and also by Chia and Hwang (1986). With regard to employment, we follow the stance taken by Jurgen (2006) and Pissarides (2000). Finally, the problem of inequality and of intellectual human capital and high-tech products could not be solved without the extremely important works of Atkinson (2015) on inequality, Hedlund (2011) on path dependence and the Russian case of market reforms, Reinert (2007) and his explanation of the division of all countries into rich and poor and the future of their economies, and Rodrik (2017), who explains that unproductive sectors of the economy grow in poor countries, and this makes them poorer and poorer in the future. In particular, we note the outstanding work of Reinert (2007), who describes the macro picture of the partnership between poor and rich countries. This methodology has something in common with our division of all countries into donors and recipients of intellectual capital.
In our opinion, only a holistic view of all the flows that make up the global circulation of intellectual capital, together with macroeconomic indicators, makes it possible to assess the real process of the movement of intellectual capital.
3. Data and Method
Taking into account the opinions of researchers on the subject, we hypothesize that the emigration of scientists and researchers from the donor country enriches the intellectual potential of the recipient country, resulting in the export of high-tech products and information technologies from the recipient country to the donor country (Figure 1).
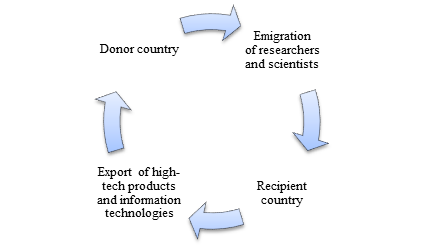
Fig. 1. Hypothetical scheme of research on the partnership of scientific emigration,
and export of high-tech products and information technologies
Thus, the donor country ‘pays’ twice: first, it invests in the development of the human capital of its citizens and then transfers this resource for free to third-party countries; second, it buys imported goods (products, services) of the IT industry, where a significant part of the added value is produced by the intellectual labor of its ex-citizens.
In order to test the hypothesis put forward, it is necessary to solve a number of tasks:
Firstly, it is necessary to decide which countries fall into the categories of ‘donor countries’ and ‘recipient countries’. We assume that the first group should include countries with abundant and/or unclaimed human capital. The second group should include countries with a developed infrastructure that contributes to the production of new technologies and innovations.
Secondly, it is necessary to create a system of indicators and define their time intervals. It is obvious that there is a time lag between the process of emigration and the export of information technologies (IT objects), which is necessary for the adaptation of people and their involvement in research work. This time lag must be taken into account when studying cause-effect relationships.
Thirdly, it is necessary to outline our research methodology. Statistical methods and tools will allow us to identify patterns in dynamics and establish relationships.
The study is based on official statistics from the World Bank (https://data.
worldbank.org/), the UN Statistical committee (https://www.un.org/), the Organization for Economic Co-operation and Development (https://data.oecd.org/), and some other international organizations.
In dividing the countries into donors and recipients, we include among the donors a certain group of countries that developed a highly productive education system in the early 1990s, producing a surplus of highly skilled workers, but with little demand from the economy. These include a number of post-Soviet countries, such as the Russian Federation, Ukraine, Belarus, Kazakhstan, and Armenia, as well as Asian countries such as China and India. As for the recipient countries, we include the states that have showed significant growth in scientific metric indicators and increased exports of innovative and high-tech products and technologies over the last decade, such as the USA, Ireland, the UK, Germany, France, the Netherlands, Sweden, and Spain.
Then, we need to set two groups of indicators:
1) Indicators for the donor countries that characterize the emigration of scientists and researchers, a decrease in scientific activity and changes in the import of information technology and IT equipment.
2) Indicators for the recipient country reflecting the growth of scientific activity and changes in the IT exports.
The proposed system of indicators characterizing the emigration of scientists (researchers) and the import of information technology can be seen in Figure 2.
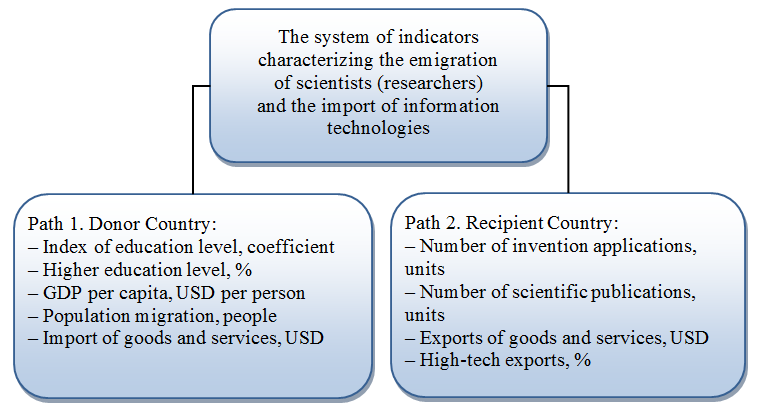
Fig. 2. The system of indicators for donor countries and recipient countries
Any economic research can be represented as a certain sequence of actions, i.e. a methodology. Moreover, each stage is characterized by a certain set of scientific knowledge methods. With regard to the object of our research, the following methods can be distinguished (Figure 3):
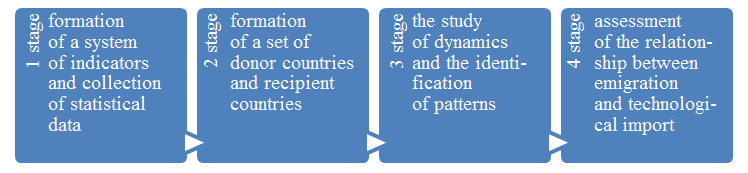
Fig. 3. The methodology of the research
4. Results
For the convenience of presentation of the results of our research, we highlight four interrelated paragraphs. The first paragraph is devoted to global trends in changes in the development of information technologies and IT objects. The second paragraph describes the changes in the dynamics and structure of indicators in the aggregate of donor countries. The third paragraph discusses the increase in the intellectual power of the recipient countries and their growing exports of IT objects. Paragraph 4 shows the relationship between the emigration of scientists and the export-import transactions in high-tech and IT objects.
4.1. Global trends in the development of information technology
In the last decade, information technologies have actively penetrated all areas of human activity, from daily life to the production of goods and the provision of services.
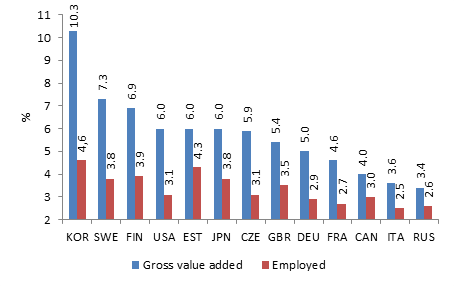
Fig. 4. The share of the IT sector in the gross value added of the business sector
and the number of persons employed in IT by countries: 2017, %
Source: Digital Economy Report. National Research University ‘High School of Economics’, Moscow, 2018.
The data presented in Figure 4 clearly show that the countries we have selected in the group of ‘recipient countries’ are among the top-10 countries in terms of IT sector, which once again underlines the importance of information technologies in the modern post-industrial economy.
Turning now to Figure 5, we analyze the dynamics of the IT sector Development Index and its components.
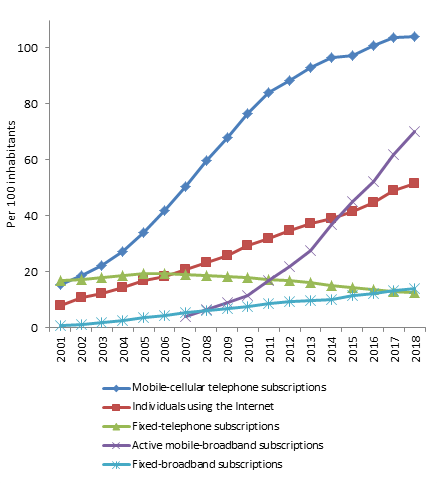
Fig. 5. Dynamics of the global ICT development, 2001–2018
Source: Measuring the Information Society Report.
As we can see, all the indicators within the index are rising, with the exception of fixed-telephone subscriptions, which is explained by the obsolescence of this technology, as well as a significant decrease in the price of mobile communications, i.e. there is a process of extrusion of one technology by another. The calculation of the average value of the IT Development Index for the selected groups of countries leads to the following results: donor countries = 5.92 points, recipient countries = 8.27, while the actual value of Student's t-test for comparing means is 4.41 (p < 0.05), which indicates the significance of the differences, so we can surely say that the level of IT development in the first group is lower than in the second. Obviously, the products of the IT sector are becoming a new resource that is actively bought and sold on the world market. And the high level of the IT sector in highly developed countries allows them to actively supply this resource to the global market. To assess the pace of development of high-tech exports, we turn to a series of graphs below (Figures 6 and 7).
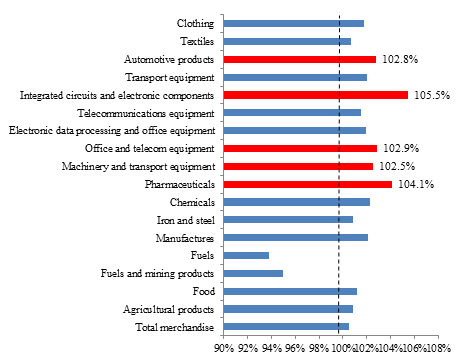
Fig. 6. The average growth (decline) in world exports of goods
by product group for the period 2014–2018, %
Source: World Trade Organization, wto.org.
As we can see from Figure 6, over the last five years, the category ‘Integrated Circuits and Electronic Components’ has seen the largest increase in exports, with an average annual growth rate of 5.5 %, while exports of fuel and mining products are below 100 %.
We also observe high values for the export of computer and information services (Figure 7).
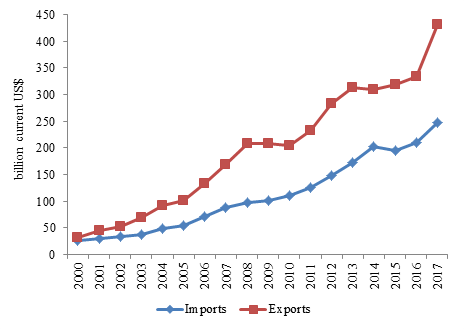
Fig. 7. The dynamics of computer and information services exports
in a global market, billions of current US dollars
Source: International Trade Statistics Yearbook.
Exports of computer and information services have been growing steadily; with the value of the indicator increasing by a factor of 14 over the period under review. Growth is also observed in relative terms, so that exports in relation to the circulation of goods increased from 2.1 % in 2000 to 9.3 % in 2017. The main exporters of this category of services in the reporting period are highly developed countries: Ireland (15.0 % of the global export of services), the USA (7.3 %), Germany (7.2 %), the United Kingdom (5.0 %), and France (3.5 %).
4.2. Dynamics and statics of indicators of donor countries
Turning to the indicators of donor countries, the following hypothesis applies: the high level of education of the population of countries with economies in transition (emerging market economies) and some developing countries, combined with the a low standard of living, leads to mass labor emigration of scientists and researchers.
First of all, we examine the education index (EI – Education index) and the tertiary gross enrolment ratio (GER) (% of tertiary school-age population) in the context of donor countries, for this we turn to Table 1.
Table 1
Dynamics of the education index and the level of higher education
in donor countries in the period 1980–2000
Countries | 1980 | 1985 | 1990 | 1995 | 2000 | |||||
GER | EI | GER | EI | GER | EI | GER | EI | GER | EI | |
Armenia | * | * | * | * | 23 | 0.633 | 19 | 0.631 | 36 | 0.668 |
Belarus | * | * | * | * | 49 | * | 41 | * | 55 | * |
China | * | 0.358 | * | 0.366 | 3 | 0.406 | 4 | 0.436 | 8 | 0.478 |
India | * | 0.240 | * | 0.282 | 6 | 0.311 | 6 | 0.339 | 10 | 0.355 |
Kazakhstan | * | 0.534 | * | 0.581 | 39 | 0.606 | 35 | 0.633 | 32 | 0.683 |
Russian | * | 0.576 | * | 0.619 | 55 | 0.660 | 43 | 0.660 | 56 | 0.723 |
Ukraine | * | 0.581 | * | 0.614 | 49 | 0.646 | 42 | 0.679 | 49 | 0.705 |
Source: Human Development Reports и Human Development Data.
* – no information.
The data in Table 1 indicate a high level of education in the post-Soviet countries, with a significant increase in the Education index in the early 1990s. It is also worth noting the more modest values for China and India, which are associated with a significant population, implying problems of scale in the formation of systemic education.
The level of tertiary education in the former members of the USSR is also high and approaches 50 %, so that every second adult citizen has a higher education, which cannot be said of China and India, but impressive populations are working in relation to these countries.
For example, the education system in the post-Soviet countries was a good basis for the production of scientists and researchers, while in China and India the economies of scale were triggered (the larger the population, the more cases of progressive-minded individuals).
Next, we examine the data in Table 2 and evaluate the standard of living of the population by analyzing the dynamics of GDP per capita.
Table 2
Dynamics of donor countries' GDP per capita for the period 1990–2000,
USD per capita
Countries | 1990 | 1991 | 1992 | 1993 | 1994 | 1995 | 1996 | 1997 | 1998 | 1999 | 2000 | Growth rate 2000 |
World | 4,290 | 4,466 | 4,669 | 4,671 | 4,940 | 5,409 | 5,449 | 5,353 | 5,269 | 5,392 | 5,493 | 128 % |
Armenia | 638 | 590 | 370 | 357 | 401 | 456 | 504 | 523 | 609 | 597 | 623 | 98 % |
Belarus | 2,125 | 1,766 | 1,668 | 1,590 | 1,460 | 1,371 | 1,452 | 1,397 | 1,512 | 1,211 | 1,276 | 60 % |
China | 318 | 333 | 366 | 377 | 473 | 610 | 709 | 782 | 829 | 873 | 959 | 302 % |
India | 368 | 303 | 317 | 301 | 346 | 374 | 400 | 415 | 413 | 442 | 443 | 121 % |
Kazakhstan | 1,647 | 1,512 | 1,515 | 1,433 | 1,320 | 1,288 | 1,350 | 1,446 | 1,469 | 1,130 | 1,229 | 75 % |
Russian | 3,485 | 3,485 | 3,096 | 2,929 | 2,663 | 2,666 | 2,644 | 2,738 | 1,835 | 1,331 | 1,772 | 51 % |
Ukraine | 1,570 | 1,490 | 1,418 | 1,258 | 1,012 | 936 | 873 | 991 | 835 | 636 | 636 | 40 % |
Source: The World Bank, worldbank.org.
Based on the World Bank data in Table 2, we can conclude that the standard of living of the population of the selected countries is significantly lower than the world average, so the gap between the world level and the value for the Russian Federation was 19 % in 1990 and 68 % in 2000. It is also necessary to point out the low values for China and India in the base period, but at the same time there is a significant increase in the indicators over the period, by three times and by 21 % respectively. A low standard of living for the population leads to forced migration from developing to developed countries. To assess this process, we turn to Table 3.
Table 3
Dynamics of net migration of population in donor countries for the period
of 1992–2017, people
Countries | 1992 | 1997 | 2002 | 2007 | 2012 | 2017 |
Armenia | –496,288 | –223,873 | –160,521 | –183,361 | –30,535 | –24,989 |
Belarus | –63,057 | 56,146 | –6,382 | 63,933 | 72,123 | 43,648 |
China | –779,982 | –382,999 | –1,965,578 | –2,178,385 | –1,552,209 | –1,741,996 |
India | –552,948 | –682,569 | –1,888,986 | –2,655,844 | –2,350,075 | –2,663,434 |
Kazakhstan | –1,439,396 | –1,261,512 | 44,530 | –35,196 | 159,807 | –90,000 |
Russian Federation | 2,490,121 | 2,374,657 | 1,778,101 | 2,326,672 | 1,800,600 | 912,279 |
Ukraine | 74,421 | –462,264 | –165,445 | 269,541 | 132,154 | 50,001 |
Source: The World Bank, worldbank.org.
Net migration is the difference between those entering and those leaving the country, so the minus sign indicates a loss of the country's population, while a plus sign indicates a gain or increase in population. As we can see, the represented countries (except for the Russian Federation) have negative values, so there is an outflow of population, including labor emigration. As for Russia, the positive values are explained by the return of citizens from 14 former republics of the USSR to the historical homeland under the influence of ethnic and religious processes that began in the 1990s in the post-Soviet countries.
Next, we turn to Table 4 and analyze the directions of emigration of Russians to more distant countries.
According to the data in the table, we can conclude that the emigration flow, which had high values in the early 1990s, had weakened by 2000, as a result of which 1.3 million people left the country in ten years.
Table 4
Dynamics of emigration of citizens of the Russian Federation
to foreign countries, people
Countries | 1990 | 1995 | 2000 | Sum |
All far abroad countries | 155,595 | 121,988 | 80,971 | 1,284,735 |
Australia | 79 | 486 | 125 | 3,880 |
Bulgaria | 324 | 174 | 146 | 2,689 |
Germany | 33754 | 79,569 | 45,264 | 616,096 |
Greece | 4184 | 1278 | 528 | 16,665 |
Israel | 61,023 | 15,198 | 16,279 | 272,502 |
Canada | 179 | 754 | 942 | 9,446 |
Poland | 178 | 226 | 99 | 2,157 |
United States | 2,322 | 10,659 | 9,509 | 121,964 |
Finland | 450 | 603 | 1,078 | 7,636 |
Sweden | 106 | 106 | 144 | 1,665 |
Latvia | 8,660 | 1,167 | 365 | 27,762 |
Lithuania | 6,684 | 1,367 | 376 | 25,589 |
Moldova | 31,400 | 8,264 | 2,237 | 137,288 |
Estonia | 5,157 | 877 | 385 | 18,310 |
others | 1,095 | 1,260 | 3,494 | 21,086 |
Source: Russian Statistical Yearbook.
The directions of emigration of Russians are noteworthy, as the largest number of citizens left for Germany (616,000 people) and Israel (273,000 people), which is explained by the policy of these states to return the descendants of forced immigrants to their historical homeland. There are also high figures for the USA (122,000 people), directly related to labor migration, as well as to Moldova (137,000 people) as a transit country for further movement to the Eurozone.
During the years of transformation of the Russian economy, about 200,000 highly qualified specialists, researchers and scientists emigrated from the country (Iontsev et al. 2001; Osipov 2007).
Further, we turn to Table 5 and assess the value of imports of goods and services for the period 1990–2018.
Table 5
Dynamics of import of donor countries for the period 1990–2018, in % of GDP
Countries | 1990 | 1995 | 2000 | 2005 | 2010 | 2015 | 2018 |
World | 19.5 | 21.5 | 25.1 | 27.6 | 28.2 | 28.6 | 29.3 |
Armenia | 46.3 | 62.2 | 50.5 | 43.2 | 45.3 | 41.9 | 53.5 |
Belarus | 43.6 | 54.1 | 72.4 | 59.1 | 63.0 | 57.9 | 69.1 |
China | 10.7 | 16.3 | 18.5 | 28.4 | 23.5 | 18.2 | 18.7 |
India | 8.5 | 12.0 | 13.9 | 22.4 | 26.9 | 22.1 | 23.6 |
Kazakhstan | * | 43.5 | 49.1 | 44.6 | 29.9 | 24.5 | 25.3 |
Russian Federation | 17.9 | 25.9 | 24.0 | 21.5 | 21.1 | 20.6 | 20.8 |
Ukraine | 28.7 | 50.2 | 57.4 | 48.4 | 51.1 | 55.2 | 53.8 |
Source: The World Bank, worldbank.org.
* – no information.
The data in Table 5 clearly show that the active importers (countries where the indicator value is above the world average) are Armenia, Belarus, and Ukraine. To assess the level of imports of IT objects, we turn to Figure 6.
a) Machinery and transport equipment, % of all import volume
b) Electrical apparatus for line telephony or line telegraphy, % of total import volume
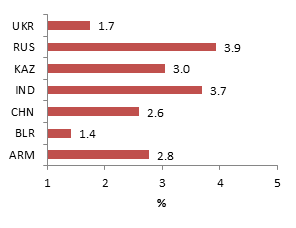
Fig. 8. Basic categories of import to donor countries in 2018
Source: International Trade Statistics Yearbook.
According to the data in Figure 8a, the share of imports of machinery and transport equipment (Standard International Trade Classification (SITC)) is high in the pending countries, and given that this category of goods is currently a product of high technology and includes a significant number of IT solutions, we can assume that our assumption about the effect of emigration on IT imports is partially confirmed. If we look at the structure of imports according to the Harmonized System (HS12), as shown in Figure 8b, the share of such category as Electrical apparatus for line telephony or line telegraphy is high in donor countries, which also indicates the dependence of developing countries on high technology imports.
4.3. Dynamics and statics of indicators of the recipient countries
In this paragraph, we examine the dynamics of the main indicators characterizing the changes in the IT sector of countries belonging to the group of ‘recipients’. First, let us evaluate the growth in the number of researchers and the results of their activities (primarily publications and patent activity).
Table 6
Dynamics of the number of researchers in R&D (per million people)
Year | DEU | ESP | FRA | IRL | GBR | NLD | SWE | USA |
2000 | 3,168 | 1,878 | 2,916 | 2,251 | 2,895 | 2,649 | * | 3,496 |
2001 | 3,246 | 1,938 | 2,987 | 2,329 | 3,081 | 2,847 | 5,169 | 3,567 |
2002 | 3,260 | 1,988 | 3,117 | 2,399 | 3,340 | 2,723 | * | 3,652 |
2003 | 3,295 | 2,172 | 3,200 | 2,522 | 3,638 | 2,704 | 5,383 | 3,895 |
2004 | 3,310 | 2,332 | 3,334 | 2,713 | 3,824 | 2,972 | 5,426 | 3,789 |
2005 | 3,335 | 2,493 | 3,313 | 2,798 | 4,124 | 2,924 | 6,085 | 3,743 |
2006 | 3,435 | 2,589 | 3,424 | 2,877 | 4,176 | 3,233 | 6,127 | 3,806 |
2007 | 3,579 | 2,699 | 3,586 | 2,935 | 4,111 | 3,093 | 5,000 | 3,781 |
2008 | 3,733 | 2,843 | 3,660 | 3,284 | 4,054 | 3,062 | 5,437 | 3,935 |
2009 | 3,922 | 2,872 | 3,747 | 3,157 | 4,077 | 2,824 | 5,080 | 4,090 |
2010 | 4,058 | 2,869 | 3,873 | 3,113 | 4,043 | 3,219 | 5,251 | 3,885 |
2011 | 4,189 | 2,766 | 3,942 | 3,326 | 3,926 | 3,664 | 5,145 | 4,027 |
2012 | 4,352 | 2,694 | 4,073 | 4,854 | 3,970 | 4,361 | 5,164 | 3,991 |
2013 | 4,367 | 2,626 | 4,155 | 5,136 | 4,119 | 4,552 | 6,674 | 4,091 |
2014 | 4,321 | 2,613 | 4,234 | 5,304 | 4,228 | 4,513 | 6,876 | 4,205 |
2015 | 4,744 | 2,623 | 4,307 | 4,784 | 4,320 | 4,673 | 6,834 | 4,267 |
2016 | 4,862 | 2,715 | 4,379 | 4,215 | 4,358 | 4,777 | 7,155 | 4,245 |
2017 | 5,003 | 2,855 | 4,450 | 4,115 | 4,341 | 5,011 | 7,597 | 4,250 |
Source: The World Bank, worldbank.org.
* – no information.
According to the data in Table 6, the number of researchers increased in all countries over the reporting period, with the largest increases is observed in the Netherlands (by 89.2 %) and Ireland (by 82.8 %). The current trend indirectly indicates that the receiving countries are being ‘absorbed’ by immigrants, thereby strengthening their position in world science.
Table 7
Dynamics of scientific and technical journal articles
Countries | 2000 | 2005 | 2010 | 2015 | 2018 | |||||
Thousand units | % of world level | Thousand units | % of world level | Thousand units | % of world level | Thousand units | % of world level | Thousand units | % of world level | |
DEU | 69.0 | 6.5 | 84.0 | 5.6 | 97.3 | 5.0 | 106.5 | 4.6 | 104.4 | 4.1 |
ESP | 25.0 | 2.3 | 35.9 | 2.4 | 49.0 | 2.5 | 55.1 | 2.4 | 54.5 | 2.1 |
FRA | 49.7 | 4.7 | 59.2 | 4.0 | 68.7 | 3.5 | 71.9 | 3.1 | 66.4 | 2.6 |
GBR | 77.2 | 7.2 | 84.9 | 5.7 | 93.8 | 4.8 | 99.6 | 4.3 | 97.7 | 3.8 |
IRL | 2.7 | 0.2 | 4.7 | 0.3 | 7.0 | 0.4 | 6.8 | 0.3 | 7.2 | 0.3 |
NLD | 18.7 | 1.8 | 24.1 | 1.6 | 29.2 | 1.5 | 31.1 | 1.4 | 30.5 | 1.2 |
SWE | 14.5 | 1.4 | 16.5 | 1.1 | 17.8 | 0.9 | 20.9 | 0.9 | 20.4 | 0.8 |
USA | 304.8 | 28.5 | 384.6 | 25.8 | 408.8 | 21.0 | 430.0 | 18.7 | 422.8 | 16.6 |
Source: The World Bank, worldbank.org.
The information presented in Table 7 clearly shows that, in absolute terms, the level of publications in scientific journals for the group of countries considered remains approximately the same (there is no stable increase or decrease), but in relative terms there is a decrease, the loss of the dominant position of the USA being especially noticeable, with a decrease of 11.9 percentage points over the period 2000–2018. The reason for this significant decline is the increase in the China's share.
An increase in the scientific potential of the recipient countries leads to an increase in patents for inventions. To assess the extent of this process, let us turn to the information contained in Table 8.
Table 8
Dynamics of patent applications by residents
Countries | 1990 | 2000 | 2010 | 2018 | ||||
Thousand units | % of world level | Thousand units | % of world level | Thousand units | % of world level | Thousand units | % of world level | |
DEU | 30.7 | 5.7 | 51.7 | 6.3 | 47.0 | 4.1 | 46.6 | 2.0 |
ESP | 2.2 | 0.4 | 2.7 | 0.3 | 3.6 | 0.3 | 1.5 | 0.1 |
FRA | 12.4 | 2.3 | 13.9 | 1.7 | 14.7 | 1.3 | 14.3 | 0.6 |
GBR | 19.3 | 3.6 | 22.1 | 2.7 | 15.5 | 1.3 | 12.9 | 0.6 |
IRL | 0.7 | 0.1 | * | * | * | * | 0.1 | 0.0 |
NLD | 2.1 | 0.4 | 2.5 | 0.3 | 2.5 | 0.2 | 2.1 | 0.1 |
SWE | 3.1 | 0.6 | 4.2 | 0.5 | 2.2 | 0.2 | 1.8 | 0.1 |
USA | 90.6 | 16.7 | 164.8 | 20.0 | 242.0 | 20.8 | 285.1 | 12.4 |
Source: The World Bank, worldbank.org.
The data in Table 8 indicate a significant share of the United States at the global level of patent applications, although the share slightly decreased during the reporting period. It is also worth pointing out a decrease in the other countries represented, since in 1990 the total share of recipient countries was about 30 %, while by 2018 it fell to 16 %, which is again explained by the emergence of China.
Undoubtedly, the growth in the indicators of science and scientific activity is reflected in the changes in indicators of the return on intellectual capital. To evaluate this process, refer to Tables 9–11.
Table 9
Royalties for the use of intellectual property, receipts (BoP, current US$)
Countries | 1990 | 2000 | 2010 | 2018 | ||||
Bn, USD | % of world level | Bn, USD | % of world level | Bn, USD | % of world level | Bn, USD | % of world level | |
DEU | 1,987 | 7.43 | 2,536 | 2.86 | 8,277 | 3.35 | 24,366 | 6.31 |
ESP | 90 | 0.34 | * | * | * | * | 2,527 | 0.65 |
FRA | 1,295 | 4.84 | 3,974 | 4.48 | 13,625 | 5.51 | 16,819 | 4.36 |
GBR | 3,055 | 11.42 | 6,749 | 7.60 | 14,203 | 5.75 | 21,680 | 5.62 |
IRL | * | 0.00 | * | * | 2,920 | 1.18 | 13,896 | 3.60 |
NLD | 1,086 | 4.06 | 2,170 | 2.44 | 24,972 | 10.11 | 35,023 | 9.08 |
SWE | 563 | 2.11 | 1,414 | 1.59 | 5,813 | 2.35 | 7,444 | 1.93 |
USA | 16,640 | 62.23 | 51,807 | 58.34 | 107,522 | 43.51 | 128,748 | 33.37 |
Source: The World Bank, worldbank.org.
* – no information.
The data in Table 9 indicate a tenfold increase in charges for the use of intellectual property for all countries over the period 1990–2018. The Netherlands (32 times) and Spain (28 times) achieved the greatest success. However, while the total share of these countries was 92.4 % in the base period, it decreased to 64.9 % in the reference period.
The result of the growth in the indicators of scientific activity is an increase in the export of IT objects, including high-tech products. To assess the dynamics of these indicators, we turn to Tables 10 and 11.
Table 10
Dynamics of export of recipient countries for the period of 1990–2018, in % to GDP
Countries | 1990 | 1995 | 2000 | 2005 | 2010 | 2015 | 2018 |
DEU | 22.8 | 22.0 | 30.8 | 38.1 | 42.6 | 46.8 | 47.4 |
ESP | 15.7 | 21.8 | 28.6 | 25.0 | 26.0 | 33.6 | 35.1 |
FRA | 21.0 | 22.6 | 28.6 | 27.0 | 26.8 | 30.6 | 31.3 |
GBR | 23.1 | 25.6 | 25.2 | 25.0 | 28.3 | 27.7 | 30.0 |
IRL | 54.6 | 73.4 | 94.5 | 79.6 | 103.0 | 122.0 | 122.3 |
NLD | 54.4 | 57.2 | 66.0 | 65.6 | 69.8 | 82.7 | 84.3 |
SWE | 28.0 | 37.2 | 43.2 | 45.0 | 44.7 | 44.3 | 45.8 |
USA | 9.3 | 10.6 | 10.7 | 10.0 | 12.3 | 12.4 | 12.2 |
Source: The World Bank, worldbank.org.
The data in Table 10 indicate an increase in the share of exports in all recipient countries, with the largest results observed in Ireland (an increase of 68 percentage points) and the Netherlands (by 30 percentage points). The stable trend observed once again underlines the effectiveness of the policy chosen in the field of science development.
Table 11
Dynamics of high-technology exports (% of manufactured exports)
Year | DEU | ESP | FRA | GBR | IRL | NLD | SWE | USA |
2007 | 15.5 | 5.6 | 20.3 | 21.1 | 30.6 | 29.0 | 16.9 | 30.5 |
2008 | 15.1 | 5.7 | 21.7 | 20.8 | 28.7 | 26.0 | 17.3 | 29.0 |
2009 | 16.9 | 6.7 | 24.4 | 20.8 | 26.4 | 28.0 | 18.9 | 25.0 |
2010 | 17.0 | 6.8 | 26.6 | 23.5 | 22.8 | 27.8 | 19.7 | 23.1 |
2011 | 16.4 | 6.8 | 25.3 | 23.6 | 24.8 | 25.1 | 18.8 | 21.1 |
2012 | 17.4 | 7.4 | 26.9 | 23.8 | 25.5 | 25.5 | 18.0 | 20.7 |
2013 | 17.4 | 8.1 | 27.3 | 23.9 | 24.8 | 26.0 | 18.0 | 20.7 |
2014 | 17.3 | 7.4 | 27.6 | 22.5 | 24.8 | 25.8 | 18.0 | 21.0 |
2015 | 17.9 | 7.6 | 28.4 | 22.7 | 28.2 | 24.1 | 18.1 | 21.9 |
2016 | 18.1 | 7.5 | 28.1 | 24.0 | 32.7 | 23.9 | 18.3 | 23.0 |
2017 | 15.9 | 7.7 | 26.1 | 23.0 | 29.0 | 22.7 | 15.4 | 19.7 |
2018 | 15.7 | 7.2 | 25.9 | 22.3 | 24.7 | 22.7 | 14.3 | 18.9 |
Source: The World Bank, worldbank.org.
The data given in Table 11 show a significant share of IT and high-technology goods in the exports of the countries (with the exception of Spain), but for Ireland, the Netherlands and the USA, the specific weights decrease over time.
If we turn to the export structure of the recipient countries in 2018 (according to the SITC), we can find a high share of the machinery and transport equipment category, ranging from 14.3 % in Ireland to 48.2 % in Germany. This once again confirms our hypothesis about the flow of IT items from highly developed countries to developing countries.
Going down to four HS12 digits of exported goods, we find a high proportion of items related to high technology, so the highest proportion is found in the Netherlands, about 9 % of all exports, while the country supplies goods to the world market in such categories as ‘Electrical apparatus for line telephony or line telegraphy’, ‘Automatic data processing machines and units thereof’, ‘Machines and apparatus used for the manufacture of semiconductor devices’, ‘Electronic integrated circuits’. The United States is in second place (5.8%), followed by Sweden (2.7 %). These figures clearly show the influence of the recipient countries on the world market for high technologies.
4.4. The dependence between emigration and high-tech exports of IT items
The set of countries in the world considered above comprises only 15 states, which is not enough to identify and measure the correlation between macroeconomic indicators. For this reason, we have expanded the initial population, although the process of creating a new population involved several stages.
1) All countries of the world available for analysis (more than 250 countries according to the World Bank classification) were ranked according to the ‘Net migration’ indicator (denoted as NM) for 1997.
2) The countries included in Q1 (25 % of the countries with the highest migration growth rates) and Q4 (25 % of the countries with the highest migration outflows) were taken from the ranked population. This procedure left about 100 countries in the sample.
3) The truncated aggregate was complemented by the High-Technology Exports indicator (denoted as HTE), averaged over the period 2014–2018.
4) The resulting set was checked for the presence of emissions (anomalous objects with high and/or low values), which were excluded from further consideration. For example, countries such as the USA (NM = 8,859,954; HTE = 20.86 %), Vietnam (NM =
= –216,001; HTE = 36.75 %), Mexico (NM = –216,001; HTE = 36.75 %) were excluded etc. As a result, the aggregate was 70 units.
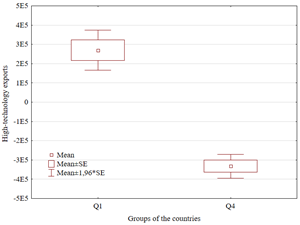
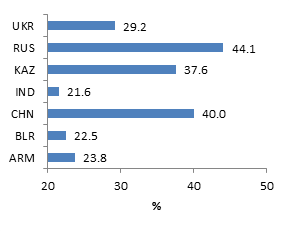
a) Groups of the countries by High-technology exports
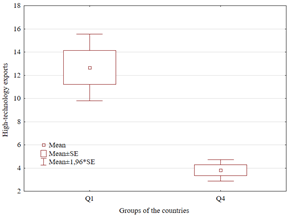
b) Groups of the countries by Net migration
Fig. 9. Intra-group averages of NM and HTE indicators for a group of developed
and developing countries in 2018
Note: constructed by the authors using the STATISTICA package, based on data from the World Bank, worldbank.org.
As shown in Figure 9, there are significant differences in the average values between the groups of countries considered, while the actual values of Student's t-statistics are equal: t (NM) = 9.95 and t (THE) = 6.03 at p < 0.01 .
5) Next, an econometric equation reflecting the effect of net migration on high-tech exports was constructed. In this case, the equation has the following characteristics:
HTE' = 8,43 + 0,000009 ´ NM
The correlation coefficient between the considered indicators is 0.48, which indicates a moderate relationship between the characteristics. The actual value of Fisher's
F-statistics is 20.70, which is higher than the table 3.98, which indicates the statistical significance of the whole regression equation. The interpretation of the obtained parameter is as follows: an increase in the inflow of migrants to the receiving country by 1 million people will increase the export of high technology by 9.3 % after 15 years, provided that the other factors remain unchanged and the patterns are stable (Figure 10).
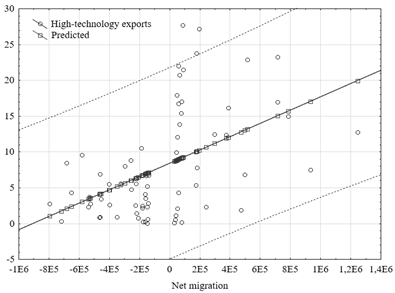
Fig. 10. Econometric model of the dependence of High-technology exports
on Net migration
Note: created by the authors using the STATISTICA package, based on data from the World Bank, worldbank.org.
Since the obtained model has satisfactory characteristics according to Fisher's
F-statistics and Student's t-statistics, we simulate the behavior of the HTE variable for different versions of the NM factor, taking the migration value in increments of 500,000 people, the simulation results are presented in Figure 11.
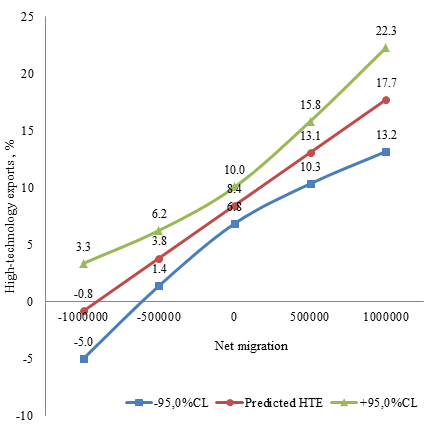
Fig. 11. Modeling the behavior of the HTE variable for various NM values
Note: created by the authors using the STATISTICA package, based on data from the World Bank.
The graph below illustrates how the level of high-tech exports changes during the transition from emigration to immigration. As we move along the OX axis, the number of entrants increases and the level of high-tech exports rises. We will focus more attention on the left side of the graph. Thus, at the level of 1 million people leaving the country, the country will see imports of IT objects, the number of people leaving 500,000 does not have a critical effect on the dependent variable (located in the green zone), but it is worth making a comment about the country's population. The result will be valid for countries with a significant number of citizens and will fail for small countries. When looking critically at the results of the econometric modeling, it is necessary to point out some weaknesses, namely, the use of a simplified model with one independent variable (i.e., other important factors are not taken into account). In addition, it is necessary to explore in more detail the lagged relationship between cause (migration) and effect (export). Despite the identified shortcomings, we believe that, to a first approximation, we have obtained strong evidence for the existence of patterns of interaction between emigration and the import of information technologies.
The regularity of labor migration from developed countries to developing countries, which we are considering, has a logically justified socio-economic basis, so in the recipient countries there is a high quality of life, the key component of which is a wage level that is above the world average. In addition, all the conditions for successful scientific activity have been created for researchers: support in the form of grants (both public and private), and the presence of high-tech laboratories, and strong links between science and industry. Thus, the outflow of scientists from donor countries can be considered a natural phenomenon.
(1) In the last quarter century, there has been a stable pattern of the outflow of highly intellectual labor force from developing to highly developed countries. As a result, scientists are ‘washed out’ from donor countries, followed by a decline in government support for scientific activity (there are no consumers of such investments), then a decrease in the number of scientific discoveries and, as a result, an explosive increase in the import of high technologies from recipient countries. This problem is particularly acute in a number of the post-Soviet countries, and especially, in Russia. With one of the best educational system (according to the world estimates), which produced highly qualified specialists and scientists in a wide range of scientific and practical fields, the country was unable to provide the necessary level of material support to these categories of citizens during the economic transformation of the 1990s. The result was the loss of a significant part of intellectual capital. The reorganization of the structure of the Soviet economy towards the dominance of the raw materials industry provoked an erroneous policy of ‘no need to produce anything, everything we need we will buy abroad’, the result of which is the current dependence on imports of IT products and services.
(2) Looking at the economic policies of highly developed countries after the Second World War, a global trend can be identified that is characterized by the concentration of all available resources on the creation and support of the IT sector. This pattern is due to the lack of natural capital (or its insignificant share in national wealth) and the inability to build up this element ‘cheaply’. At the same time, the transformation of the glo-bal economy in the post-industrial era has led to the growth of the services sector based on information technology. Realizing the need to increase the weight of the IT sector in the shortest possible time, the recipient countries have been actively attracting leading scientists from around the world over the past 25 years, which has significantly increased the share of IT exports, as confirmed by our study.
(3) In the situation we have described in the donor countries, there is no place for scientists, they are not needed, since all technologies and high-tech products come from the recipient countries, that is, the donor country, by importing technology, facilitates the departure of its scientists from the country. In other words, it is not just the fact that scientists want to live better that causes them to go abroad, but the policy of the donor country is such that scientists are forced to go where their developments are in demand. The growth of intellectual capital in developed countries is ensured by developing countries, hence the growth of exports of high-tech products and technologies from developed countries to developing countries. A donor country has a demand for users (and consumers) of high-tech products and a recipient country has a demand for scientists who produce these products. Thus, the law of the international division of labor is implemented in the market for high-tech products and highly intellectual human capital.
5. Conclusion
It is quite difficult to separate intellectual and non-intellectual migration in the world, since many people, even without higher education, come to the recipient country to study at universities and later to pursue an intellectual profession. In addition, there is no general and well-structured data on ‘intellectual’ and ‘non-intellectual’ migration in the world, so the situation in each country must be considered separately. In the CIS, for example, there are cases when candidates and doctors of sciences from post-Soviet countries who come to Russia and work in the construction industry, and who are unable to realize their potential in the profession at home, and who are unable to get a job due to various barriers and characteristics of the labor market. In our work, we make an attempt to study the relationship between general migration and the product component of intellectual capital.
According to the results of the research, we can conclude that the three most important characteristics act as factors in the described flow of intellectual human capital and high-tech products and technologies.
1. Since the recipient countries have better living and working conditions, higher wages and more secure human rights, the outflow of scientists seems to be a natural phenomenon.
2. Calculations show that there is no demand for scientists and their development in the donor country, since such a country receives high technologies and products from the recipient countries, which means that the donor country's policy is aimed at reducing funding for science. Despite the increase in science funding in Russia as a percentage of budget expenditure, its actual value still lags significantly behind the level of funding in monetary terms in recipient countries. In addition, there is the effect of gauge or dependence on the previous path, which was outlined by the policy of recent years: ‘we do not need to produce anything, everything we need we will buy abroad’. Such industrial and scientific policies have contributed to the simplification of the economy and the outflow of intellectual capital abroad.
3. On the contrary, the demand for scientists in recipient countries is growing as high-tech products become the main export commodity. Recipient countries of intellectual human capital have no other export opportunities – they are poor in mineral resources, and in the light of the transition to the post-industrial era, services become the main product produced, which means that the high-tech sector is the only way to balance the country's balance of payments.
These three factors form the mechanism for the outflow of intellectual human capital from donor countries (low GDP per capita) to recipient countries (with high GDP per capita).
The growth of intellectual capital in developed countries is ensured by developing countries, hence the growth of exports of high-tech products and technologies from developed countries to developing countries. A donor country has a demand for users (and consumers) of high-tech products, and a recipient country has a demand for scientists who produce these products. Thus, the law of the international division of labor is implemented in the market of high-tech products and highly intellectual human capital.
Recent initiatives by Trump's administration in in the area of migration policy correct the global inflow and outflow of scientists and the brain drain situation as a whole. Firstly, some groups of people, mostly Muslims, have been banned from entering the United States. Secondly, in his executive orders, Trump promised ‘enhanced vetting’ that would focus on preventing the entry of foreign nationals deemed to be threats to public safety and ensuring the collection of information necessary to assess the admissibility of applicants (Pierce and Selee 2017). It could not help but affect the development of scientific relations and the migration of scientists, because they are the most likely to be suspected of searching and gathering information, and since this usually involves the latest technologies, the line between research and espionage is very thin. The aggravation of relations between the United States and China has led, among other things, to the closure of the flow of Chinese scientists to the United States. Tensions between the United States and Russia have also had a significant impact on the intellectual flows.
It should be noted that other countries took advantage of the restrictive US immigration policy and began to attract scientists from third world countries. Among these countries, Israel and Germany stand out. Migration policy can be effective in attracting scientists from other countries to innovate the economy and increase high technologies, but it can also be ineffective with the inflow of poorly educated refugees. Of course, this is a humanitarian issue, but the economic answer is determined.
NOTES
1 Digital Economy Report of National Research University High School of Economics: https://issek.hse.ru/data/2018/11/14/1141212573/NTI_N_110_14112018.pdf.
2 International Trade Statistics Yearbook / UN Comtrade Database: https://comtrade.un.org/pb/.
3 Human Development Reports / UNITED NATIONS DEVELOPMENT PROGRAMME: http://hdr.undp.org/en/content/education-index.
4 Human Development Data / UNITED NATIONS DEVELOPMENT PROGRAMME: http://hdr.undp.org/en/data#.
5 Measuring the Information Society Report 2018 / Committed to connecting the world: https://www.itu.int/en/ITU-D/Statistics/Pages/publications/misr2018.aspx.
REFERENCES
Ali, M. A., Hussin, N., Haddad, H., Al-Araj, R., Abed, I. A. 2021. Intellectual Capital and Innovation Performance: Systematic Literature Review. Risks 9 (2): 170.
Atkinson, A. B. 2015. Inequality. What Can Be Done? Harvard University Press, Cambridge, Massachusetts, London, England.
Bamel, U., Pereira, V., Del Giudice, M. and Temouri, Y. 2022. The Extent and Impact of Intellectual Capital Research: A Two Decade Analysis. Journal of Intellectual Capital 23 (2): 375–400. https://doi.org/10.1108/JIC-05-2020-0142.
Beham, B., Baierl, A., Eckner, J. 2020. When does Part-Time Employment Allow Managers with Family Responsibilities to Stay on the Career Track? A Vignette Study among German Managers. European Management Journal 38 (4): 580–590.
Beine, M., Docquier, F., Rapoport, H. 2001. Brain Drain and Economic Growth: Theory and Evidence. Journal of Development Economics 64 (1): 275–289.
Beine, M., Docquier, F., Rapoport, H. 2008. Brain Drain and Human Capital Formation in Developing Countries: Winners and Losers. Economic Journal 118 (528): 631–652.
Belitski, M., Aginskaja, A., Marozau, R. 2019. Commercializing University Research in Transition Economies: Technology Transfer Offices or Direct Industrial Funding? Research Policy 48 (3): 601–615.
Bhagwati, J., Hamada, K. 1974. The Brain Drain, International Integration of Markets for Professionals and Unemployment. A Theoretical Analysis. Journal of Development Economics 1 (1): 19–42.
Bigne, E. 2020. Human Interactions and Research Developments. European Journal of Management and Business Economics 29 (1): 1–2.
Carr, S. C., Inkson, K., Thorn, K. 2005. From Global Careers to talent Flow: Reinterpreting ‘Brain Drain’. Journal of World Business 40 (4): 386–398.
Cervantes, M., Guellec, D. 2002. The Brain Drain: Old Myths, New Realities. Society 230: 40–42.
Chang, P. 1992. Brain Drain in East Asia. Studies in Comparative International Development 27: 3.
Chia, R. C., Hwang, K. K. 1986. Relationship between Internal–External Control and Brain Drain. Journal of Social Behavior and Personality 1: 423–427.
Choi, B., Ravichandran, T., O Connor, G. C. 2019. Organizational Conservatism, Strategic Human Resource Management, and Breakthrough Innovation. IEEE Transactions on Engineering Management 66 (4): 529–541.
Cui, A. S., Xiao, Y. 2019. The Role of Market and Technical Information Generation in New Product Development. Journal of Product Innovation Management 36 (3): 305–330.
Dabic, M., Vlacic, E., Ramanathan, U., Egri, C. P. 2020. Evolving Absorptive Capacity: The Mediating Role of Systematic Knowledge Management. IEEE Transactions on Engineering Management 67 (3): 783–793.
Docquier, F., Rapoport, H. 2012. Globalization, Brain Drain, and Development. Journal of Economic Literature 50 (3): 681–730.
Edvinsson, L.; Malone, M. S. 1997. Intellectual Capital: Realizing Your Company's True Value by Finding its Hidden Brainpower. New York: HarperBusiness.
Fassio, C., Montobbio, F., Venturini, A. 2019. Skilled Migration and Innovation in European Industries. Research Policy 48 (3): 706–718.
Finn, M. G., Pennington, L. A. 2018. Stay Rates of Foreign Doctorate Recipients from U.S. Universities, 2013. URL: https://orise.orau.gov/stem/reports/stay-rates-foreign-docto-rate-recipients-2013.pdf. Accessed 1.11.2021.
Frey, C. B., Osborne, M. A. 2017. The Future of Employment: How Susceptible are Jobs to Computerisation? Technological Forecasting and Social Change 114: 254–280. doi: 10.1016/j.techfore.2016.08.019.
Galor, O., Tsiddon, D. 1997. The Distribution of Human Capital and Economic Growth. Journal of Economic Growth 2 (1): 93–124.
Galor, O., Tsiddon, D. 1994. Human Capital Distribution, Technological Progress and Economic Growth. Mimeo: Brown University.
Greenberg, D. S. 1964. Brain Drain – The View from this Side of the Atlantic. Science 143 (3608): 787–787.
Gruetzemacher, R., Paradice, D., Lee, K. B. 2020. Forecasting Extreme Labor Displacement: A Survey of AI Practitioners. Technological Forecasting and Social Change 161: 120323.
Hagopian, A., Thompson, M. J., Fordyce, M., Johnson, K. E., Hart, L. G. 2004. The Migration of Physicians from sub-Saharan Africa to the United States of America: Measures of the African Brain Drain. Human Resources for Health 2: 10.
Haque, N. U., Kim, S.-J. 1995. Human Capital Flight: Impact of Migration on Income and Growth. IMF Staff Papers 42 (3): 577–607.
Hedlund, S. 2011. Invisible Hands, Russian Experience, and Social Science. Approaches to Understanding Systemic Failure. Press Syndicate of the University of Cambridge.
Heredia Pérez, J. A., Geldes, C., Kunc, M. H., Flores, A. 2019. New Approach to the Innovation Process in Emerging Economies: The Manufacturing Sector Case in Chile and Peru. Technovation 79: 35–55.
Hicks, J. R. 1963 [1932]. The Theory of Wages. 2nd ed. London: Macmillan.
Inkson, K., Carr, S. C., Edwards, M., Hooks, J., Jackson, D., Thorn, K., et al. 2004. From Brain Drain to Talent Flow: Views of Expatriate. Kiwis, University of Auckland. Business Review 6 (2): 29–39.
Iontsev V. A., Lebedeva N. M., Nazarov M. V., Okorokov A. V. 2001. Emigration and Repatriation in Russia. Moscow: Popechitel'stvo o nuzhdakh ros. repatriantov. Original in Russian (Ионцев В. А., Лебедева Н. М., Назаров М. В., Окороков А. В. Эмиграция и репатриация в России. Москва: Попечительство о нуждах рос. Репатриантов).
Iontsev, V. A., Ryazantsev, S. V., Iontseva, S. V. 2016. Emigration from Russia: New Trends and Forms. Ekonomika regiona 12 (2): 499–509. Original in Russian (Ионцев В. А., Рязанцев С. В., Ионцева С. В. Новые тенденции и формы эмиграции из России. Экономика региона, 12 (2): 499–509).
Iredale, R. 2001. The Migration of Professionals: Theories and Typologies. International Migration 39 (5): 7–26.
Judd C. H. 1925. The Psychology of Social Institutions. Journal of Abnormal Psychology and Social Psychology 20 (2): 151–156.
Jurgen, K. 2006. Work as a Problem in European History. An Introduction. International Economic History Congress, Helsinki, 21–25 August, Session 115.
Khakhuk, B., Morgunovа, N., Nosenko, L., Posokhova, L., Zatsarinnaya, E. 2021. Causes and Consequences of the Academic Migration from BRICS Countries to Developed Economies. Electronic Journal of Knowledge Management 19 (3): 255–268.
Khoshkish, A. 1966. Intellectual Migration – A Sociological Approach to ‘Brain Drain. Journal of World History 10 (1): 187.
Khramova, M. N., Ryazantsev, S. V. 2018. Factors of Emigration from Russia: Regional Features. Ekonomika regiona 14(4): 1298–1311. Original in Russian (Храмова М. Н., Рязанцев С. В. Факторы эмиграции из России в постсоветский период: региональные особенности. Экономика региона 14 (4): 1298–1311).
Korotayev, A., Goldstone, J. A., and Zinkina, J. 2015. Phases of Global Demographic Transition Correlate with Phases of the Great Divergence and Great Convergence. Technological Forecasting and Social Change 95: 163–169.
Kuo, C.-I., Wu, C.-H., Lin, B.-W. 2019. Gaining from Scientific Knowledge: The Role of Knowledge Accumulation and Knowledge Combination. R and D Management 49 (2): 252–263.
Lam, K. C. 2002. Interaction between Economic and Political Factors in the Migration Decision. Journal of Comparative Economics 30: 488–504.
Lomborg, B. 2020. Welfare in the 21st Century: Increasing Development, Reducing Inequality, the Impact of Climate Change, and the Cost of Climate Policies. Technological Forecasting and Social Change 156: 35. doi: 10.1016/j.techfore.2020.119981.
Mahmood, T., Mubarik, M. S. 2020. Balancing Innovation and Exploitation in the Fourth Industrial Revolution: Role of Intellectual Capital and Technology Absorptive Capacity. Technological Forecasting and Social Change 160: 120248.
Matricano, D. 2020. The Effect of R&D Investments, Highly Skilled Employees, and Patents on the Performance of Italian Innovative Startups. Technology Analysis and Strategic Management 32 (10): 1195–1208.
McCallum, C. 2006. Globalization, Development and Trends in the New International Division of Labour. Research Papers in International Business 19 (99): 6–10.
Min, S., J. Kim, Sawng, Y. W. 2020. The Effect of Innovation Network Size and Public R&D Investment on Regional Innovation Efficiency. Technological Forecasting and Social Change 155: 13. doi: 10.1016/j.techfore.2020.119998.
Mountford, A. 1997. Can a Brain Drain be Good for Growth in the Source Economy? Journal of Development Economics 53(2): 287–303.
Ortiz-Gallardo, V. G., Tietze, F., Probert, D. R., Phaal, R. 2014. Technology Acquisition through Collaboration: Practical Insights for Technology Suppliers. International Journal of Technology Intelligence and Planning 10 (1): 67–85.
Osipov, G. V. 2007. Sociology and Society: Sociological Analysis of the Time of Troubles in Russia. Moscow: Norma. Original in Russian (Осипов, Г. В. Социология и общество: социологический анализ российской смуты. М.: НОРМА).
Ozer, M., Zhang, G. 2019. The Roles of Knowledge Providers, Knowledge Recipients, and Knowledge Usage in Bridging Structural Holes. Journal of Product Innovation Management 36 (2): 224–240.
Pan, X., Pan, X., Ai, B., Guo, S. 2020. Structural Heterogeneity and Proximity Mechanism of China's Inter-Regional Innovation Cooperation Network. Technology Analysis and Strategic Management 32 (9): 1066–1081.
Pang, T., Lansang, M. A., Haines, A. 2002. Brain Drain and Health Professionals. British Medical Journal 324 (7336): 499–500.
Phillips, F. Y., Oh, D.-S. 2016. Technology Assessment and the Social and Human Impact of Innovation. Bulletin of the Atomic Scientists 72 (6): 402–411. doi: 10.1080/00963 402.2016.1240484.
Pierce, S., Selee, A. 2017. Immigration under Trump: A Review of Policy Shifts in the Year Since the Election. Policy Brief of Migration Policy Institute. URL: https://www.migra-tionpolicy.org.
Pissarides, Ch. A. 2000. Equilibrium Unemployment Theory. The MIT Press, Cambridge, Massachusetts, London, England.
Quintero-Quintero, W., Blanco-Ariza, A. B., Garzón-Castrillón, M. A. 2021. Intellectual Capital: A Review and Bibliometric Analysis. Publications 9 (4): 46.
Rangus, K., Černe, M. 2019. The Impact of Leadership Influence Tactics and Employee Openness toward Others on Innovation Performance. R and D Management 49 (2):
168–179.
Rauch, J., Trindale, V. 2002. Ethnic Chinese Networks in International Trade. Review of Economics and Statistics 84: 116–130.
Reinert, E. 2007. How Rich Countries Got Rich… And Why Poor Countries Stay Poor. London; Constable.
Rodrik, D. 2017. Straight Talk on Trade. Ideas for a Sane World Economy. Princeton University Press.
Ryazantsev, S. V. 2018. Emigration from Russia: About Conceptual Categories. Sotsiologicheskie Issledovaniya 8: 48–53. Original in Russian (Рязанцев С. В. Эмиграция из России: к вопросу о понятийном аппарате. Социологические исследования 8: 48–53).
Ryasantsev, S. V., Pismennaya, E. E. 2013. Emigration of Scientists from Russia: ‘Circulation’ or ‘Brain-Drain’. Sotsiologicheskie Issledovaniya 4: 24–35. Original in Russian (Рязанцев С. В., Письменная Е. Е. Эмиграция ученых из России: «циркуляция» или «утечка» умов. Социологические исследования 4: 24–34).
Saxenian, A. L. 2005. From Brain Drain to Brain Circulation: Transnational Communities and Regional Upgrading in India and China. Studies in Comparative International Development 40 (2): 35–61.
Sick, N., Preschitschek, N., Leker, J., Bröring, S. 2019. A New Framework to Assess Industry Convergence in High Technology Environments. Technovation 84–85: 48–58.
Silva, S. E., Venancio A., Silva J. R., and Goncalves, C. A. 2020. Open Innovation in Science Parks: The Role of Public Policies. Technological Forecasting & Social Change 151: 119844. doi: 10.1016/j.techfore.2020.120047.
Stark, O., Helmenstein, C., Prskawetz, A. 1997. A Brain Gain with a Brain Drain. Economics Letters 55 (2): 227–234.
Torres, P., Augusto, M. 2020. Digitalisation, Social Entrepreneurship and National Well-Being. Technological Forecasting and Social Change 161: 120279.
Vidal, J.-P. 1998. The Effect of Emigration on Human Capital Formation. Journal of Population Economics 11 (4): 589–600.
Wagner, C. S., Whetsell, T. A., Mukherjee, S. 2019. International Research Collaboration: Novelty, Conventionality, and Atypicality in Knowledge Recombination. Research Policy 48 (5): 1260–1270.